

Real data processing#
This section presents an example of processing real experimental data using HTTomo from the TomoBank data archive.
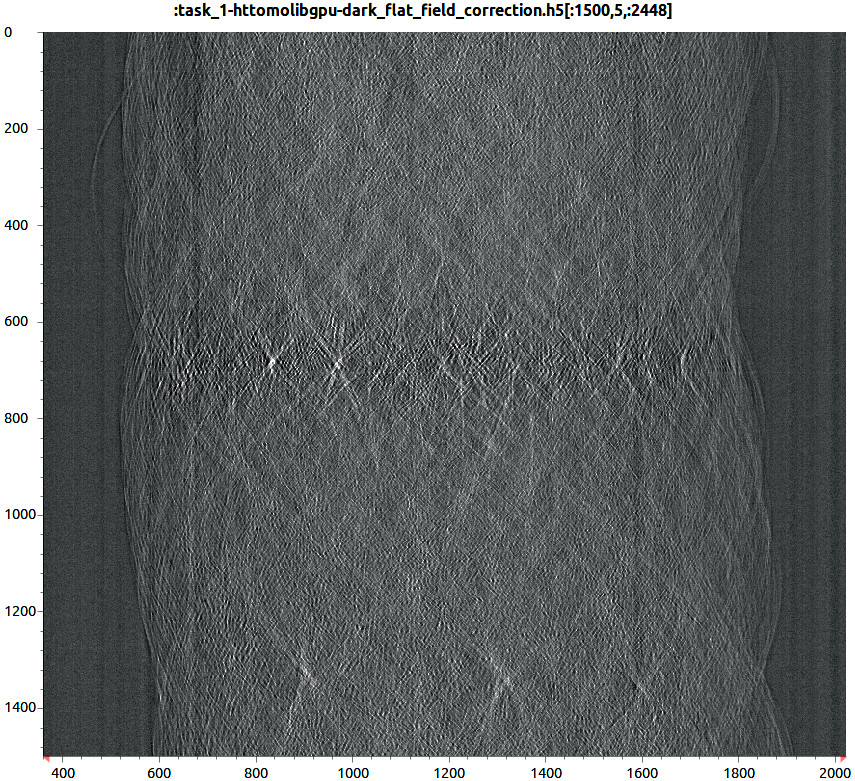
Fig. 12 Dark/Flat field corrected sinogram of the Lorentz data set.# |
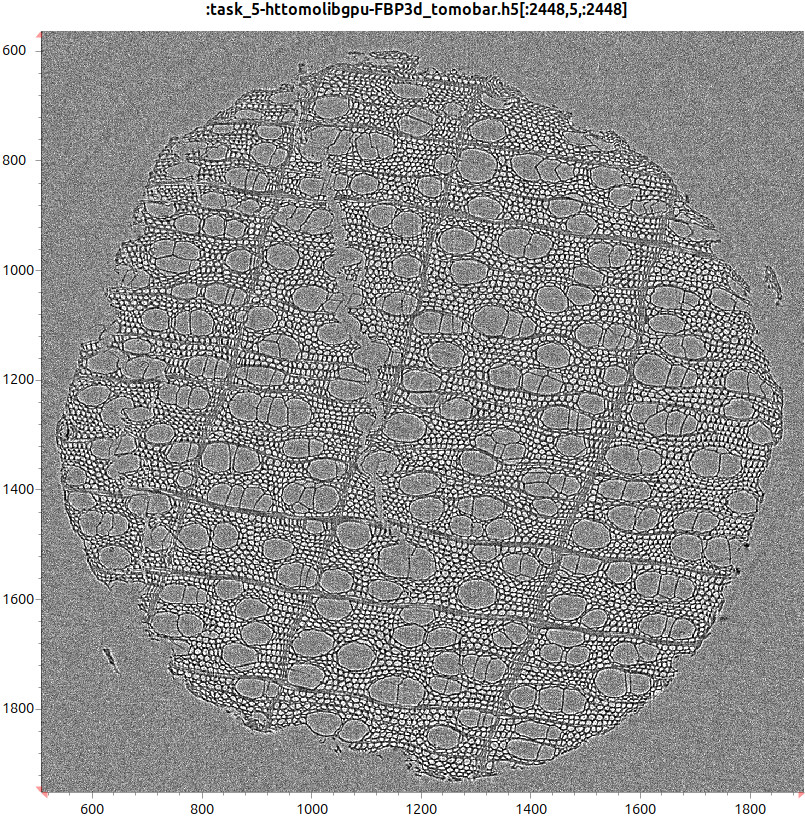
Fig. 13 Reconstructed slice using FBP method# |
Before starting, we assume that HTTomo has been successfully installed. If you have not installed HTTomo yet, please follow the Installation Guide.
We also recommend running the Run HTTomo tests to verify that all required dependencies are installed and that the framework is functioning correctly.
For this example, we will use raw data from the TomoBank data archive. Please download the Lorentz data set. The dataset is hosted using the Globus file management system, which requires authentication. You can sign in using your GitHub credentials.
Once the dataset has been downloaded, you should have the file tomo_00088.h5 on your disk. You can then proceed with running a simple HTTomo pipeline.
TomoPy (CPU) pipeline#
This pipeline uses the CPU implementation of the TomoPy library. TomoPy must be installed before running the pipeline. See Supported libraries.
Running this pipeline requires TomoPy package to be installed, see Supported libraries. Copy the following pipeline into a YAML file,
for example: tomopy_tomo_00088.yaml.
Standard 180 degrees pipeline using TomoPy (CPU) for tomo_00088.h5 dataset
- method: standard_tomo
  module_path: httomo.data.hdf.loaders
  parameters:
    data_path: /exchange/data
    image_key_path: null
    rotation_angles:
      user_defined:
        start_angle: 0
        stop_angle: 179.876
        angles_total: 1500
    preview:
      detector_y:
        start: 500
        stop: 510
    darks:
      file: input_data
      image_key_path: null
      data_path: /exchange/data_dark
    flats:
      file: input_data
      image_key_path: null
      data_path: /exchange/data_white
    continuous_scan_subset: null
- method: normalize
  module_path: tomopy.prep.normalize
  parameters:
    cutoff: null
    averaging: mean
- method: find_center_vo
  module_path: tomopy.recon.rotation
  parameters:
    ind: mid
    smin: -50
    smax: 50
    srad: 6
    step: 0.25
    ratio: 0.5
    drop: 20
  id: centering
  side_outputs:
    cor: centre_of_rotation
- method: remove_all_stripe
  module_path: tomopy.prep.stripe
  parameters:
    snr: 3
    la_size: 61
    sm_size: 21
    dim: 1
- method: minus_log
  module_path: tomopy.prep.normalize
  parameters: {}
- method: recon
  module_path: tomopy.recon.algorithm
  parameters:
    center: ${{centering.side_outputs.centre_of_rotation}}
    sinogram_order: false
    algorithm: gridrec
    init_recon: null
- method: calculate_stats
  module_path: httomo.methods
  parameters: {}
  id: statistics
  side_outputs:
    glob_stats: glob_stats
- method: rescale_to_int
  module_path: httomolib.misc.rescale
  parameters:
    perc_range_min: 0.0
    perc_range_max: 100.0
    bits: 8
    glob_stats: ${{statistics.side_outputs.glob_stats}}
- method: save_to_images
  module_path: httomolib.misc.images
  parameters:
    subfolder_name: images
    axis: auto
    file_format: tif
    asynchronous: true
Then run HTTomo according to Outside Diamond documentation. In particular, provide the path to the input dataset, the pipeline YAML file, and the output directory.
$ python -m httomo run path/to/tomo_00088.h5 tomopy_tomo_00088.yaml /path/to/output_folder
GPU pipeline#
If a CUDA-enabled GPU is available, the same dataset can be processed using GPU-accelerated libraries. This can significantly reduce the processing time for suitable pipelines. Run the pipeline bellow in a similar way as explained above.
GPU-enabled processing for tomo_00088.h5 dataset
- method: standard_tomo
  module_path: httomo.data.hdf.loaders
  parameters:
    data_path: /exchange/data
    image_key_path: null
    rotation_angles:
      user_defined:
        start_angle: 0
        stop_angle: 179.876
        angles_total: 1500
    preview:
      detector_y:
        start: 500
        stop: 510
    darks:
      file: input_data
      image_key_path: null
      data_path: /exchange/data_dark
    flats:
      file: input_data
      image_key_path: null
      data_path: /exchange/data_white
    continuous_scan_subset: null
- method: dark_flat_field_correction
  module_path: httomolibgpu.prep.normalize
  parameters:
    flats_multiplier: 1.0
    darks_multiplier: 1.0
    upper_bound: null
    lower_bound: null
    clipping_warning: false
- method: find_center_vo
  module_path: httomolibgpu.recon.rotation
  parameters:
    ind: mid
    average_radius: 0
    cor_initialisation_value: null
    smin: -50
    smax: 50
    srad: 6.0
    step: 0.5
    ratio: 0.5
    drop: 20
  id: centering
  side_outputs:
    cor: centre_of_rotation
- method: remove_all_stripe
  module_path: httomolibgpu.prep.stripe
  parameters:
    snr: 3.0
    la_size: 61
    sm_size: 21
    dim: 1
    normalize: false
- method: minus_log
  module_path: httomolibgpu.prep.normalize
  parameters: {}
- method: FBP3d_tomobar
  module_path: httomolibgpu.recon.algorithm
  parameters:
    center: ${{centering.side_outputs.centre_of_rotation}}
    detector_pad: false
    filter_freq_cutoff: 0.35
    recon_size: null
    recon_mask_radius: 0.95
- method: calculate_stats
  module_path: httomo.methods
  parameters: {}
  id: statistics
  side_outputs:
    glob_stats: glob_stats
- method: rescale_to_int
  module_path: httomolib.misc.rescale
  parameters:
    perc_range_min: 0.0
    perc_range_max: 100.0
    bits: 8
    glob_stats: ${{statistics.side_outputs.glob_stats}}
- method: save_to_images
  module_path: httomolib.misc.images
  parameters:
    subfolder_name: images
    axis: auto
    file_format: tif
    asynchronous: true
Output results#
In the output folder you will find:
Copied YAML file with the executed pipeline.
Debug log and the user log, see more Interpret Log File.
The result of the reconstruction saved as HDF5 file. This file can be open, for instance with Dawn software.
Saved tiff files of the reconstructed image. You can use ImageJ or ImageJ.JS to visualise.