

Run output, logs and monitoring#
Unless --output-folder-name is supplied, HTTomo creates a timestamped run
directory named DD-MM-YYYY_HH_MM_SS_output below OUT_DIR. Every run
contains:
user.logThe concise progress information also shown in the terminal.
debug.logDetailed diagnostic information, including messages from individual ranks.
- Pipeline copy
A copy retaining the source filename, with omitted default parameters added for ordinary YAML runs. JSON input is recorded as
pipeline.json.
Depending on the pipeline and command-line options, the directory may also contain intermediate HDF5 files, image directories, snapshots and monitoring output.
See Command-line interface for the output-related command-line options.
Intermediate HDF5 files#
save_result: true saves the result after that method. --save-all adds
equivalent saves after every eligible method. Files normally use this pattern:
TASK-ID-PACKAGE-METHOD[-ALGORITHM].h5
For reconstruction output, --recon-filename-stem NAME replaces that stem
and produces NAME.h5. Each intermediate file stores the main volume at
/data and also records /angles and
/data_dims/detector_x_y.
By default, HTTomo selects an HDF5 chunk length automatically.
--frames-per-chunk can set it explicitly, and
--compress-intermediate enables BLOSC compression. Compression requires
chunked storage, so requesting contiguous storage together with compression
falls back to automatic chunking.
Image output and sweeps#
The save_to_images method controls the image directory, format and bit
depth. The backend writer may append the bit depth and format to the configured
subfolder_name; for example, the quickstart’s images configuration
produces images8bit_tif.
A parameter sweep automatically saves images after each swept method;
do not add a separate save_to_images immediately after it. Sweep directories
use the method name and selected bit depth, for example
images_sweep_FBP3d_tomobar32bit_tif.
Snapshots#
--save-snapshots writes representative JPEG images to
pipeline_stages_snapshots. Snapshots are intended for rapid inspection and
debugging, not as quantitative output.
Monitoring output#
Use --monitor summary for aggregate timing text or --monitor bench for
one CSV row per source, method, sink and total timing event. Direct output to a
file with --monitor-output FILE; the default is standard output. More than
one --monitor option may be supplied.
The benchmark CSV contains these fields:
Field |
Meaning |
|---|---|
|
Event type and MPI rank that produced it. |
|
Pipeline operation and its configured identity. |
|
Axis along which the block was divided. |
|
Block position within the rank’s chunk and complete dataset. |
|
Shape of the recorded block. |
|
Host elapsed time for the event. |
|
GPU execution and transfer times, or zero for CPU-only events. |
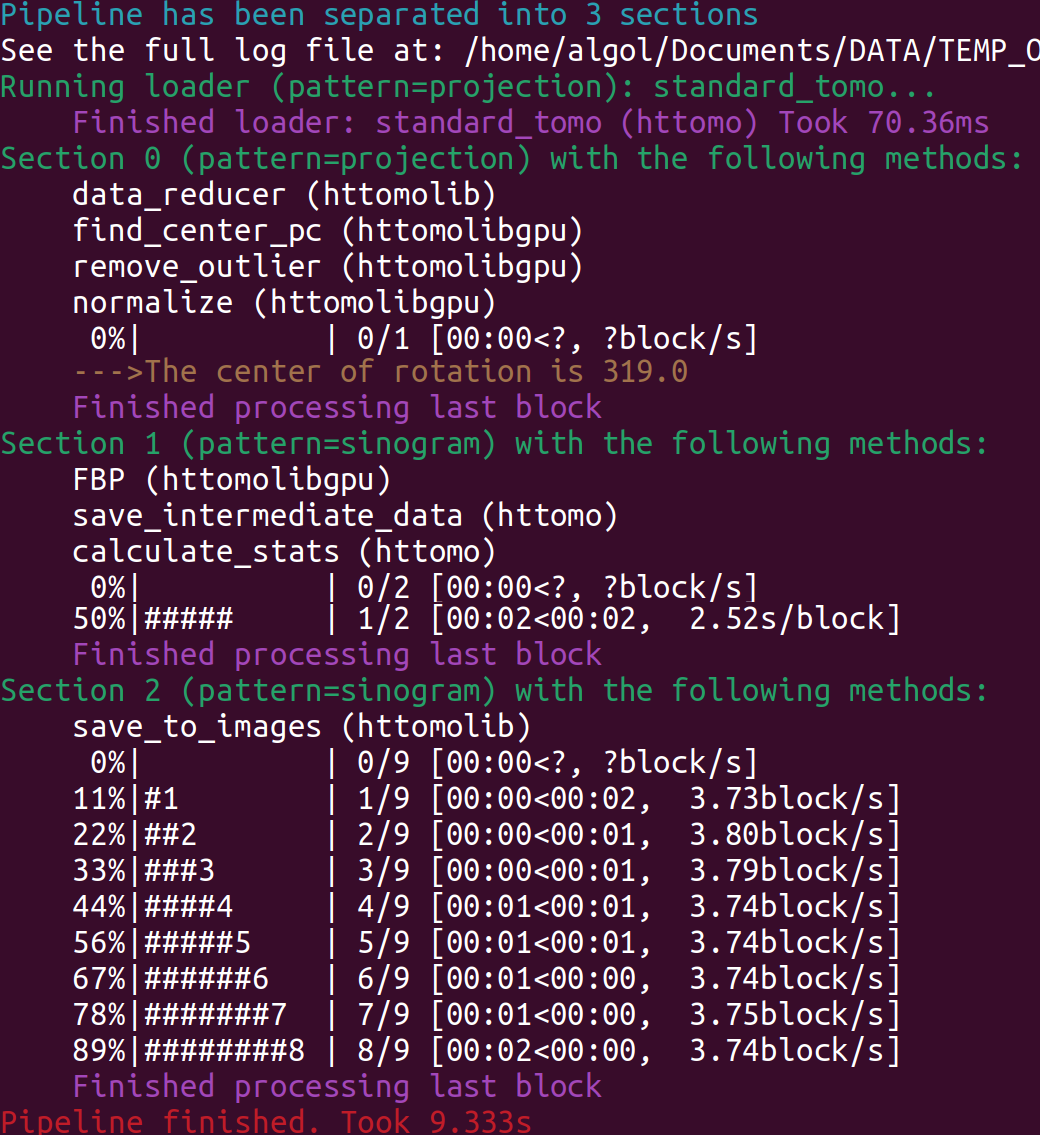
Fig. 22 Terminal output, which is also recorded in user.log.#
Common log messages#
Pipeline has been separated into N sectionsThe pipeline has been divided into
NSections. Each section groups methods that process the data as Chunks and Blocks. A section processes all its input data before the next section starts.Running loaderThe loader runs before the pipeline sections. It initially loads data using the
projectionpattern, which is also used by the first section. See Re-slicing.Section N with the following methodsThe listed methods run sequentially on each block in the section.
Finished processing the last blockindicates that the section has processed all its input data.
A progress bar may look like this:
50%|##### | 1/2 [00:02<00:02, 2.52s/block]
It reports progress through the data blocks, not through individual methods:
50%and1/2One of two blocks has been processed.
00:02<00:02Two seconds have elapsed and approximately two seconds remain.
2.52s/blockThe estimated processing time per block. For faster operations, this may instead be displayed as blocks per second (
block/s).
Note
A block may be processed by several methods. The progress bar therefore counts completed blocks rather than completed methods.