The user interface of SuRVoS is split in two different panels. The left panel (red) contains the main components that are built into SuRVoS and that will help the user through the segmentation process. The right panel (green), instead, lists the main interfaces to the data that is being analysed.
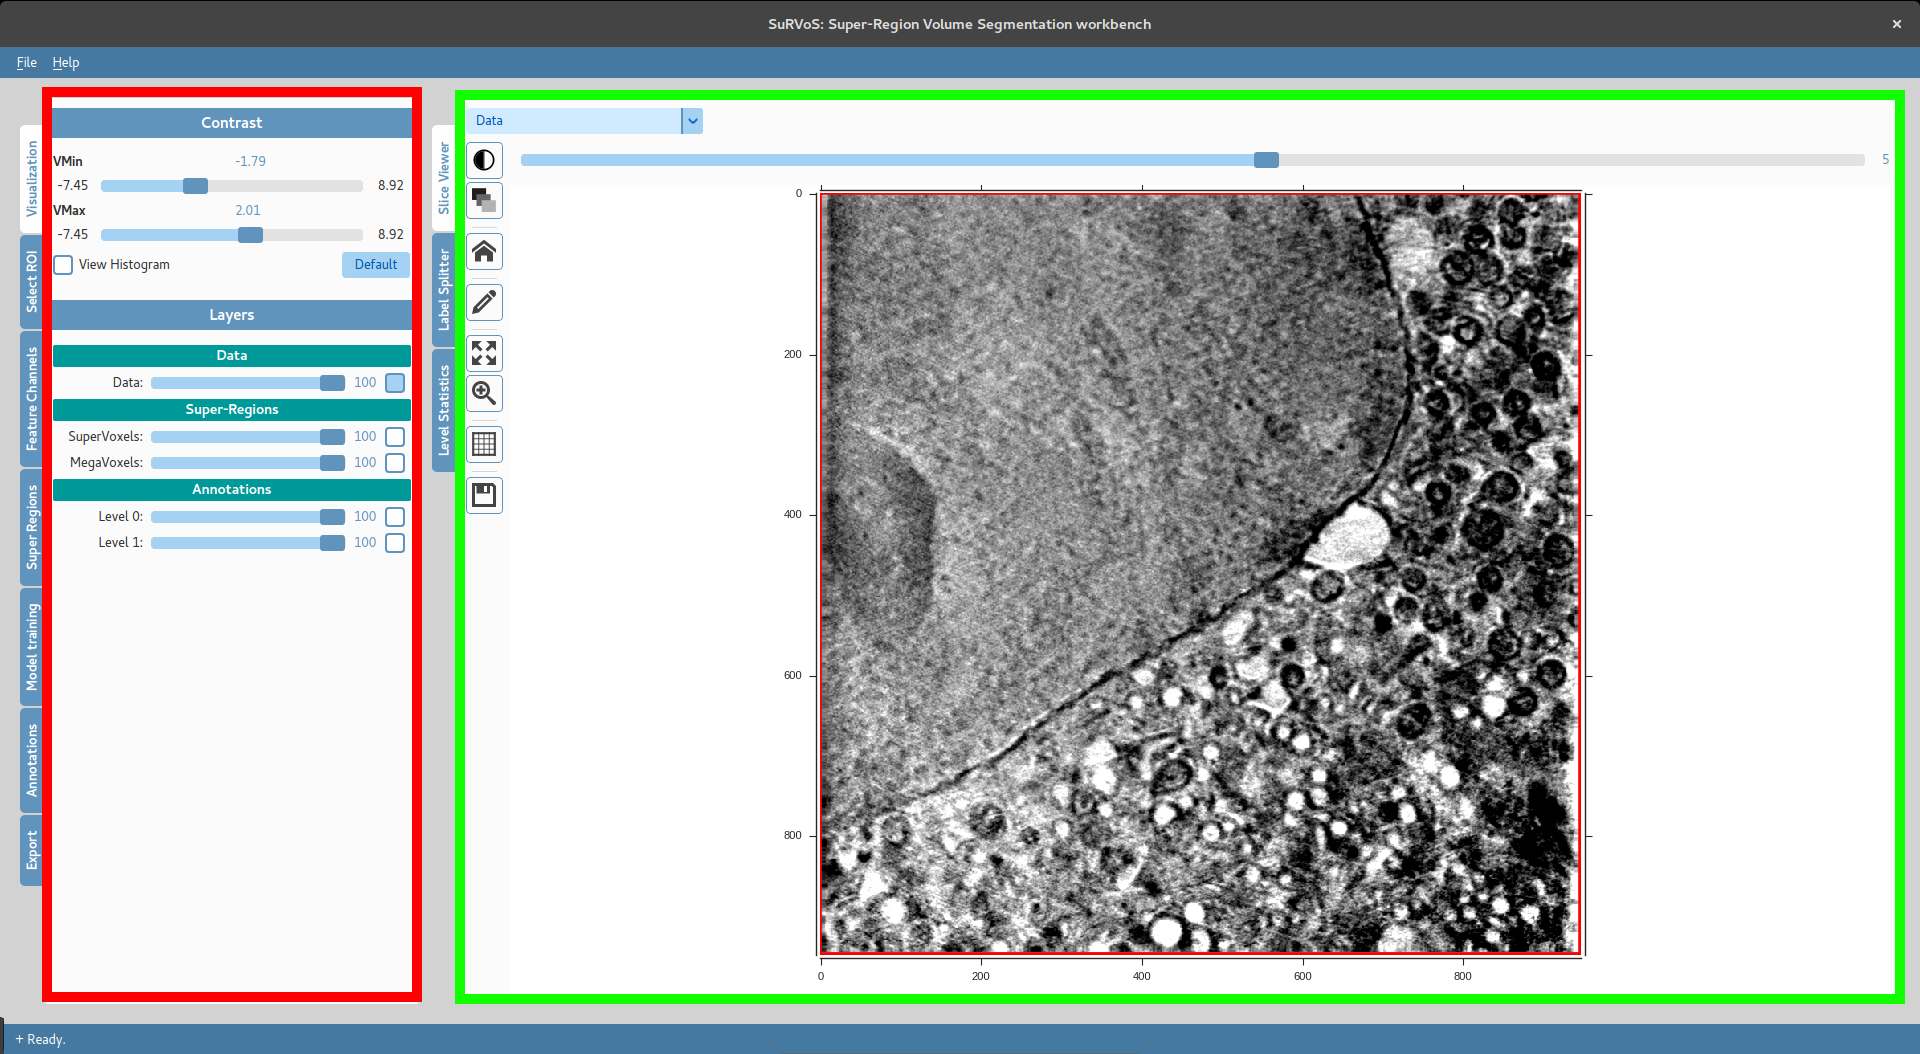
Below are listed the main components of SuRVoS with a summary of their function.
Visualization
Every step of the SuRVoS’ framework stores temporary files in HDF5 format (refer to introduction) than can be inspected to assess the correctness of fine-tune parameters. SuRVoS introduces visualization layers to control the visualization and opacity of each of these results, allowing an enhanced stacked visualization of different results (such as annotations on top of supervoxels on top of the result of the TV filter).
Region of Interests
In order to assist through the segmentation process, different Regin of Interests (RoIs) can be created. RoIs are defined in the form of a bounding cube enclosing the objects or area of interest. Once RoIs are created, the user can swap from one to another, limiting every further action of SuRVoS to that region.
Feature Channels
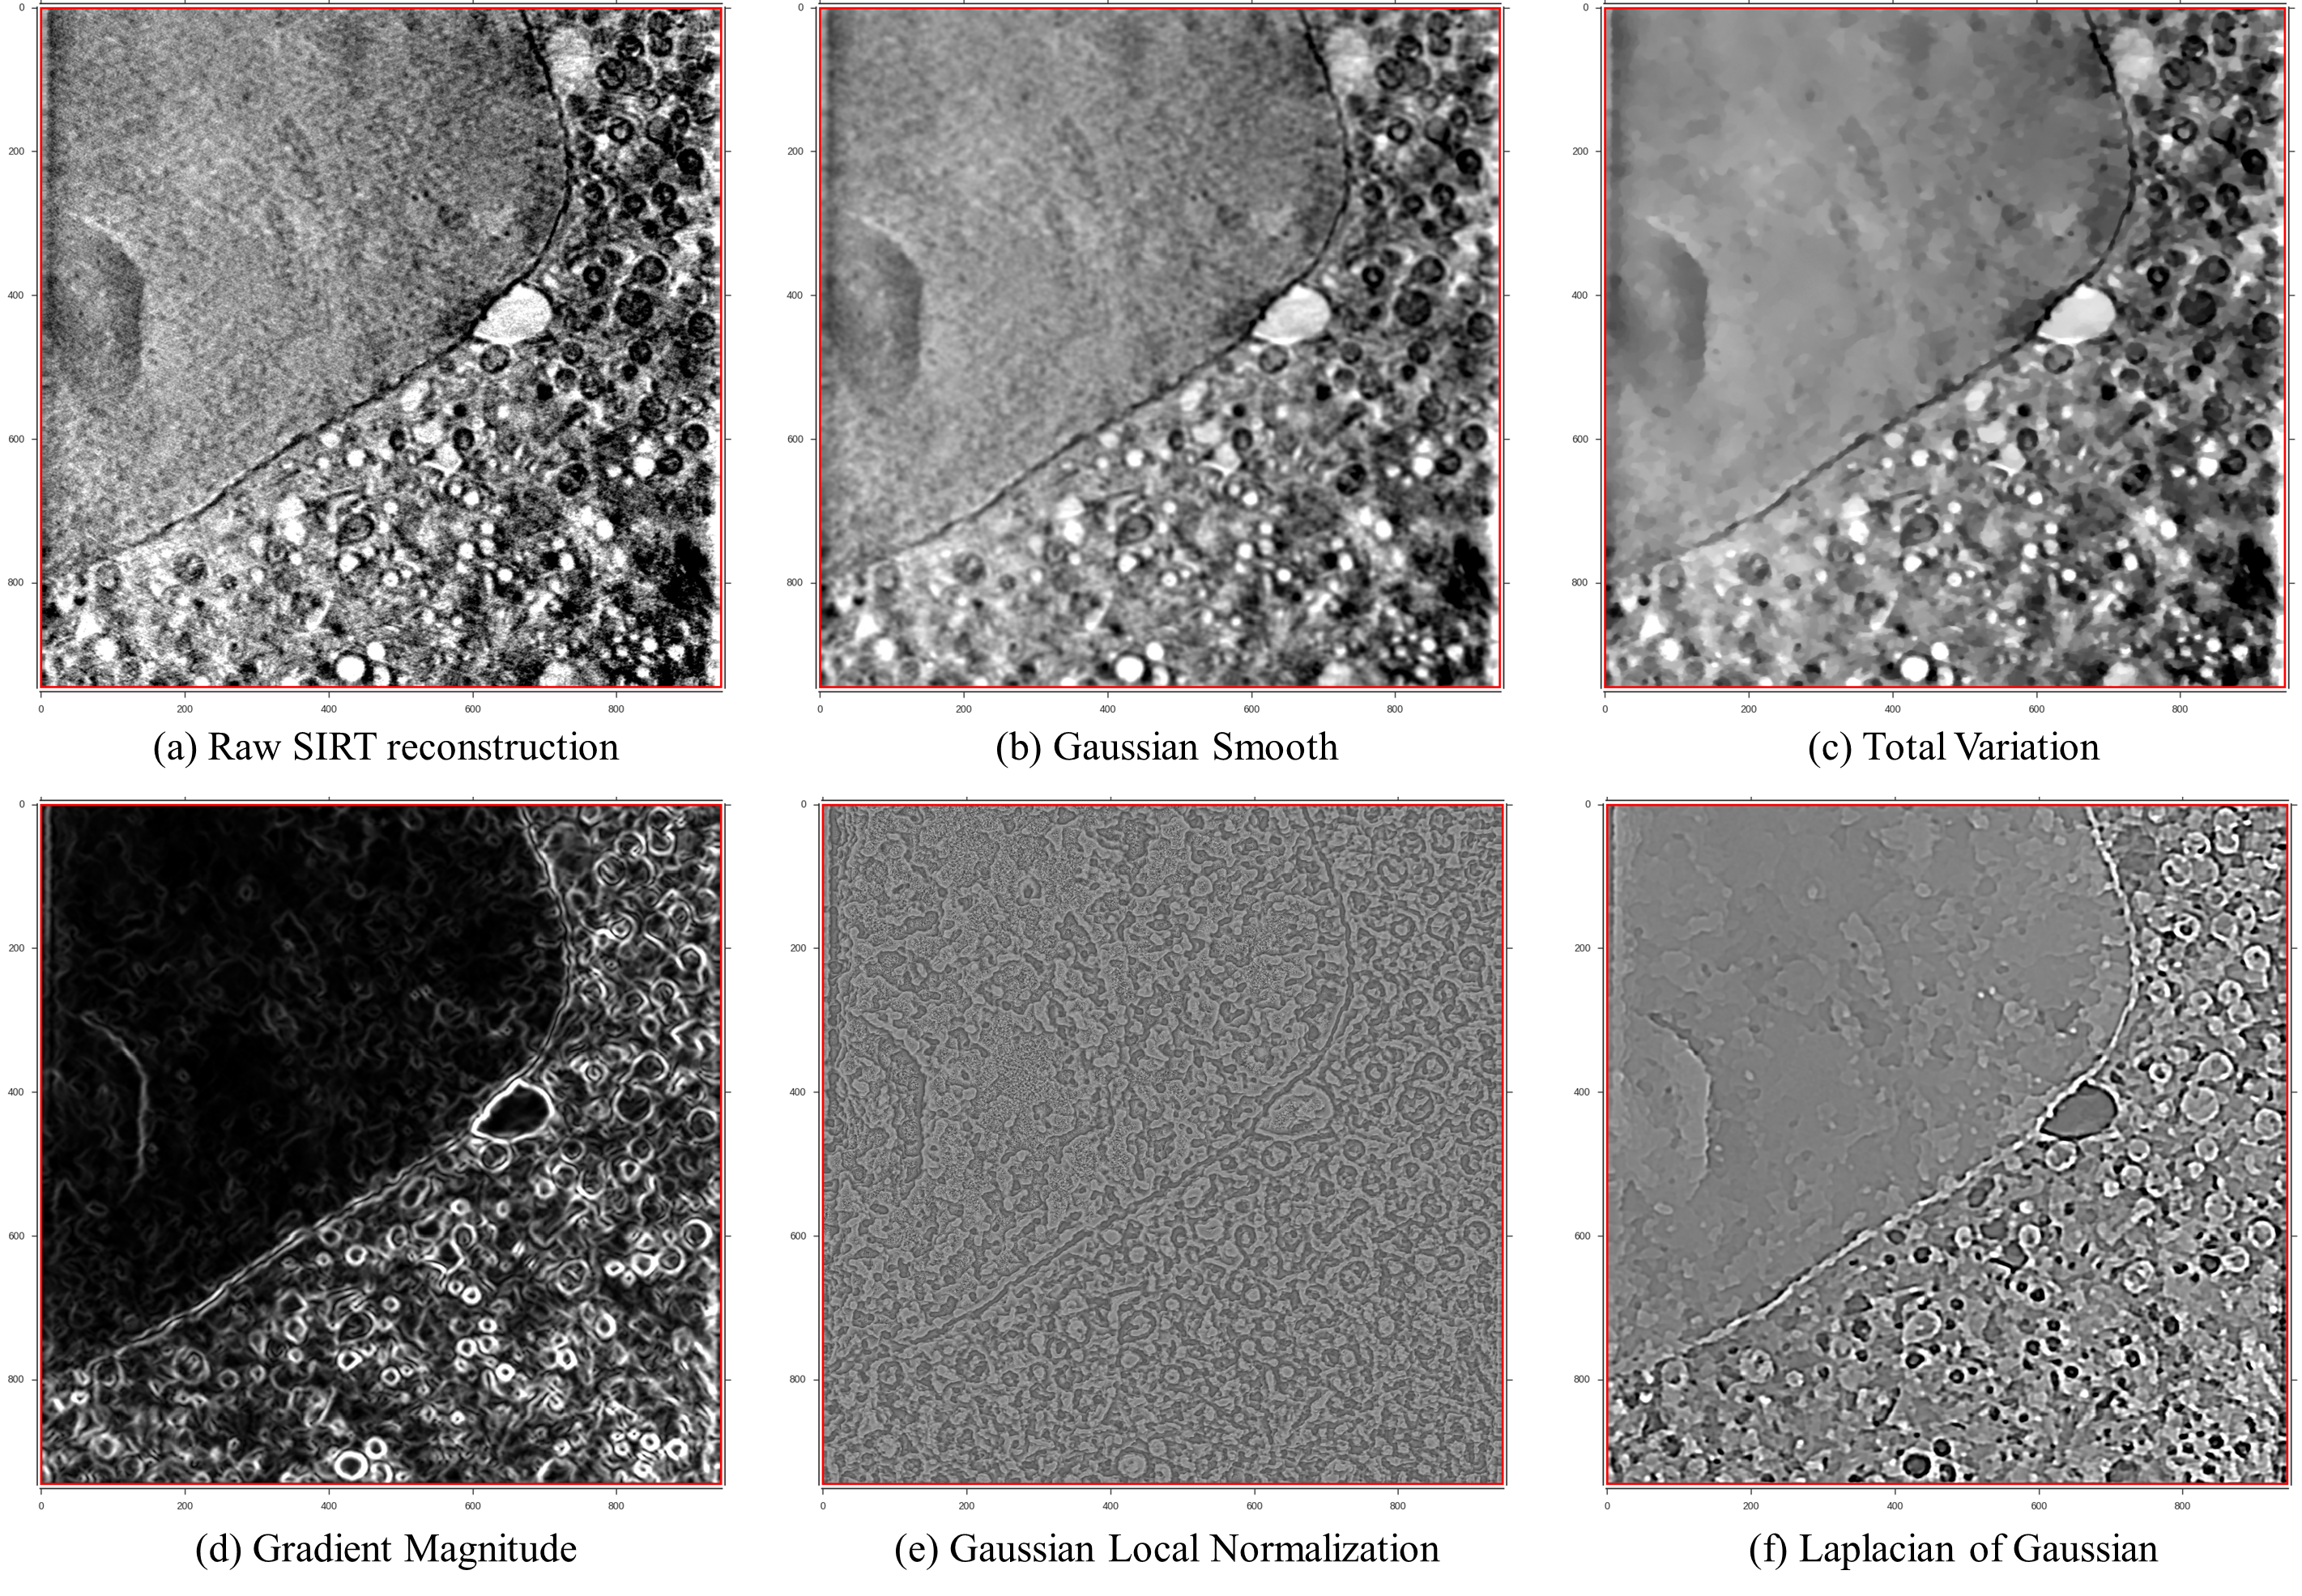
The data pre-processing step combines both denoising and textural feature extraction methods to enhance aspects of the data and make future classification easier. Denoising includes standard Gaussian and Total Variation (TV) filters. While Gaussian filters usually produce over-smoothed results, TV methods preserve strong volume edges and tend to split the volume in piece-wise smooth regions. In addition to these denoising methods, a number of textural features is available, such as Gaussian derivative filters, difference of Gaussians and Laplacian of Gaussians, rotation and scale invariant filters and the eigenvalues of the Hessian matrix and Structure tensor, as they are more robust feature extraction methods that help identify hidden characteristics of the data.
Super-Regions
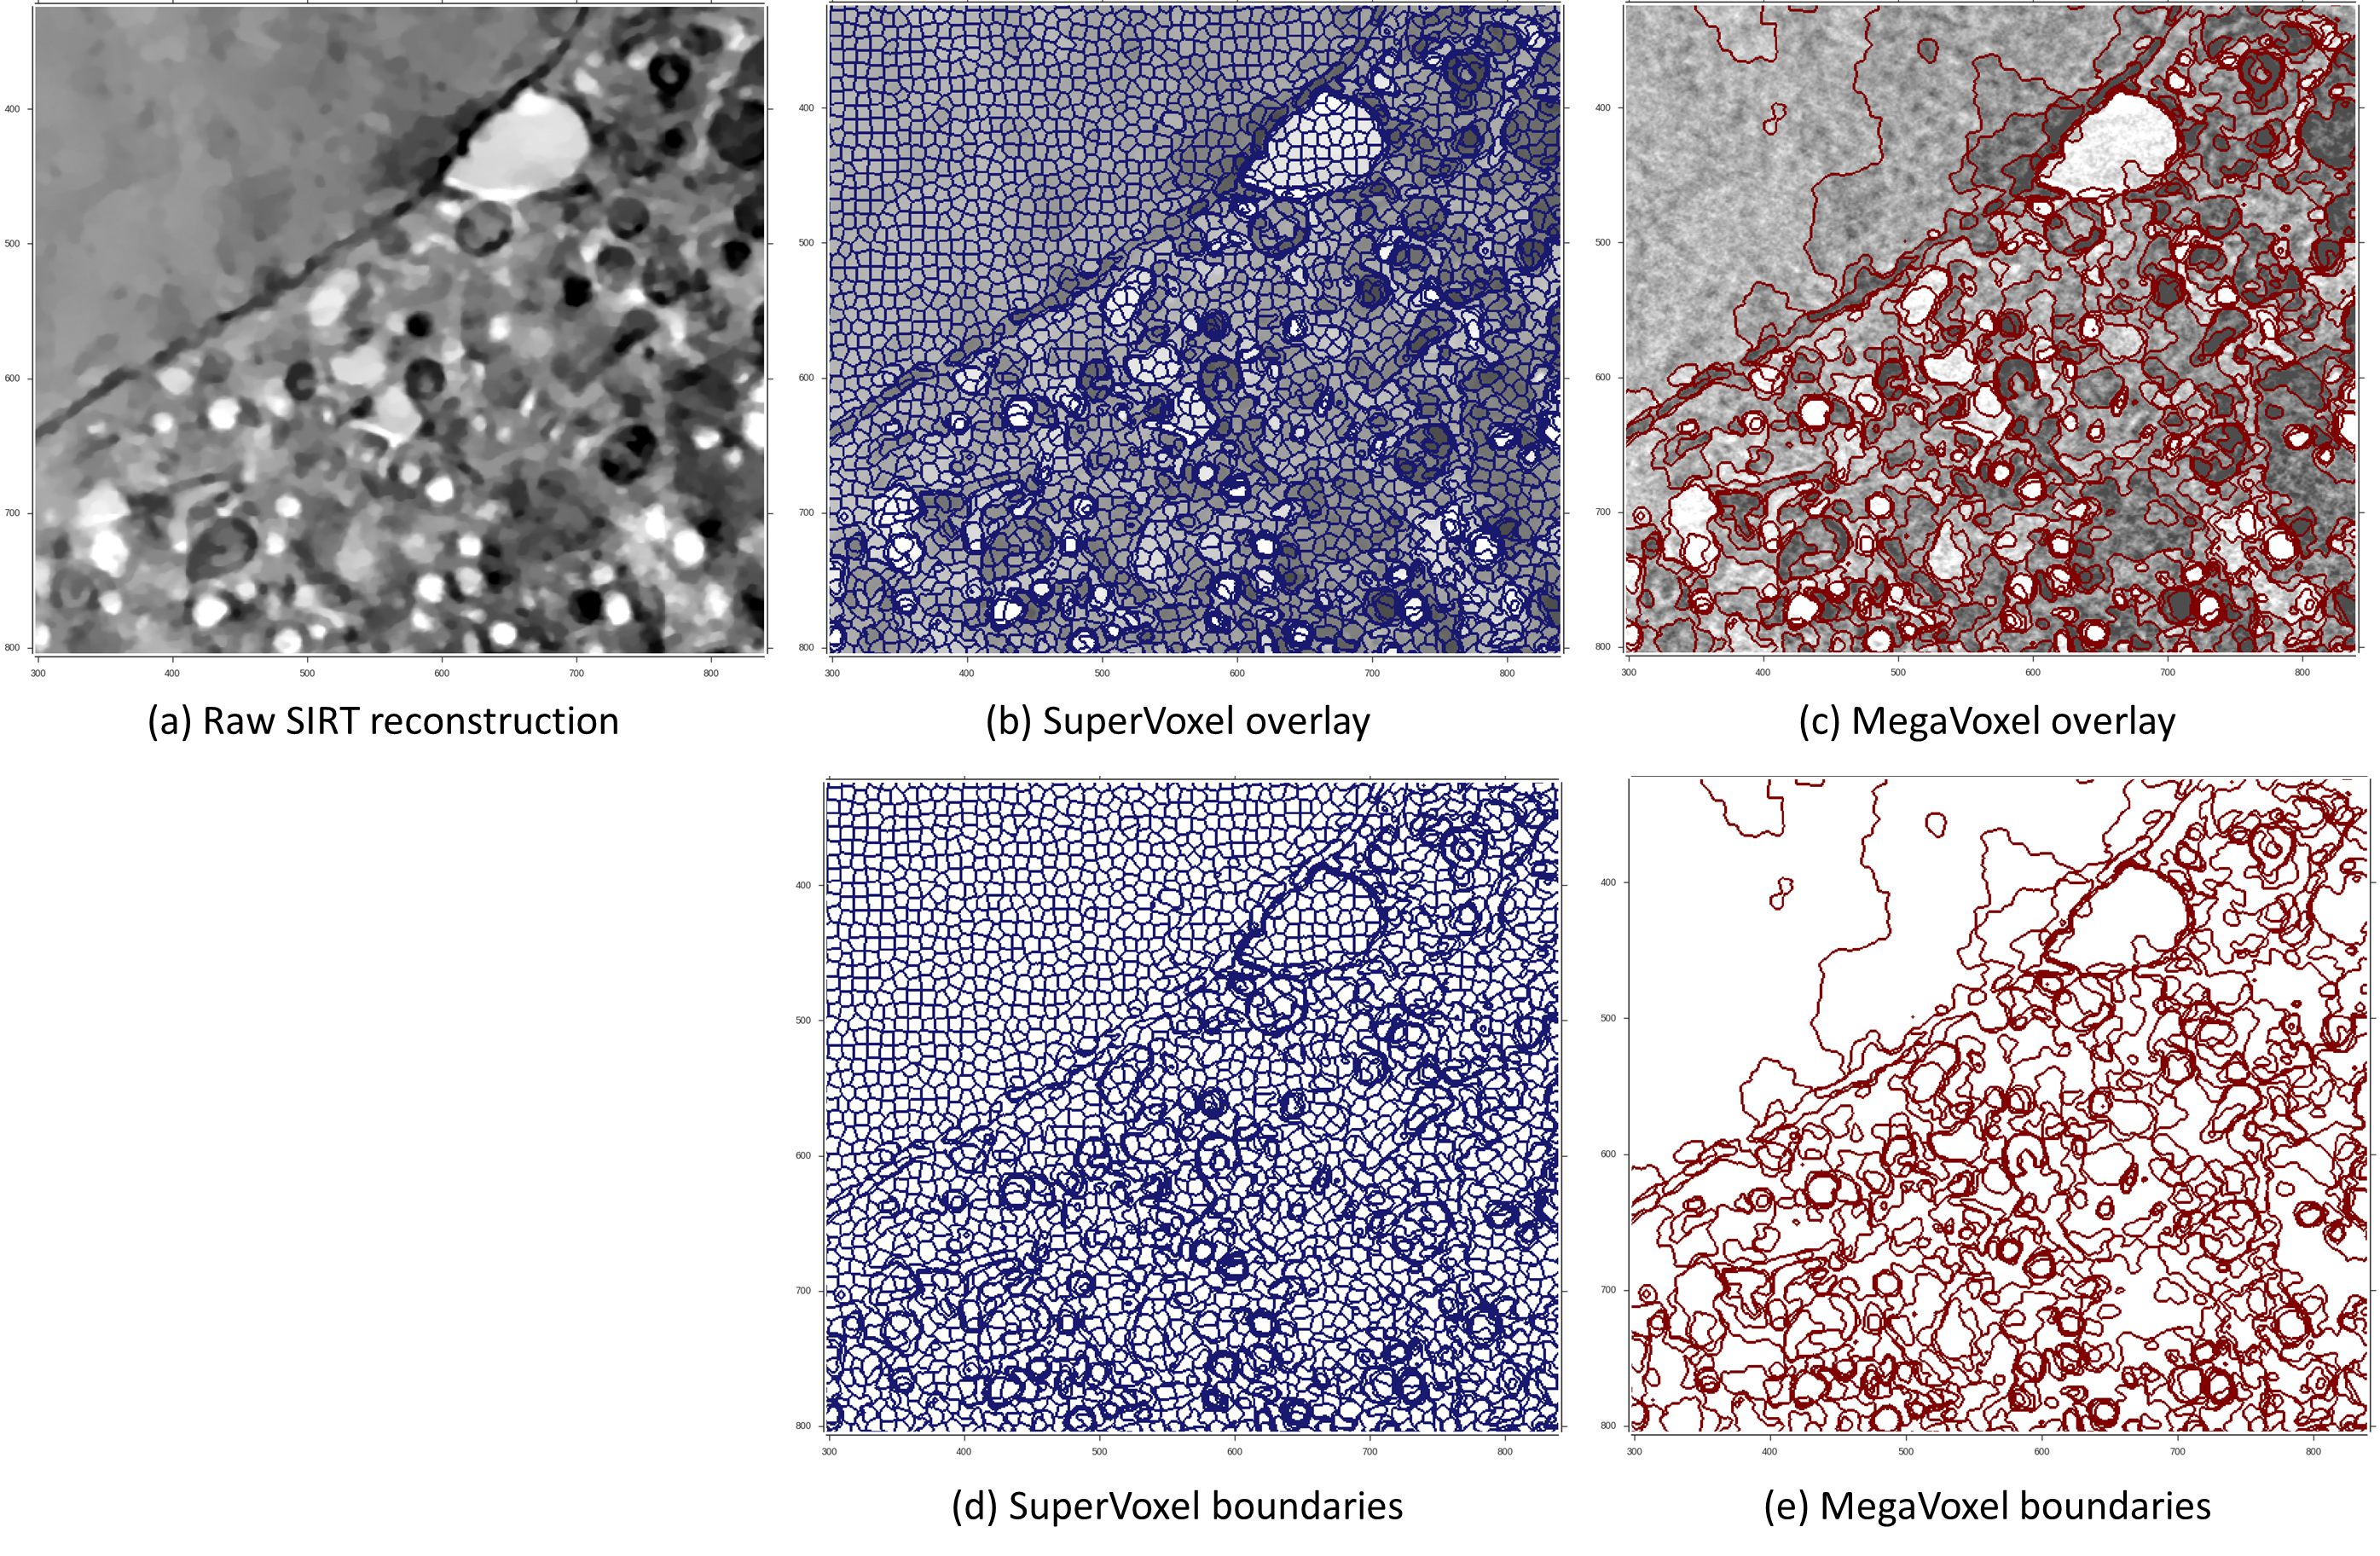
The volumetric data is represented as super regions within a 3-layer hierarchical structure. This structure is composed of voxels, supervoxels and megavoxels. Each of these layers is formed by grouping similar and nearby elements of the previous layer. That is, while voxels represent standard volume voxels, supervoxels are groups of adjacent voxels grouped together into a meaningful region that preserves strong volume boundaries (ie. boundaries between different biological features in the image). Similarly, megavoxels are groups of nearby supervoxels that have similar appearance. With this hierarchical partitioning, large areas of the volume belonging to the same object are represented by: a set of thousands of voxels, tens of supervoxels or a few megavoxels.
Model Training
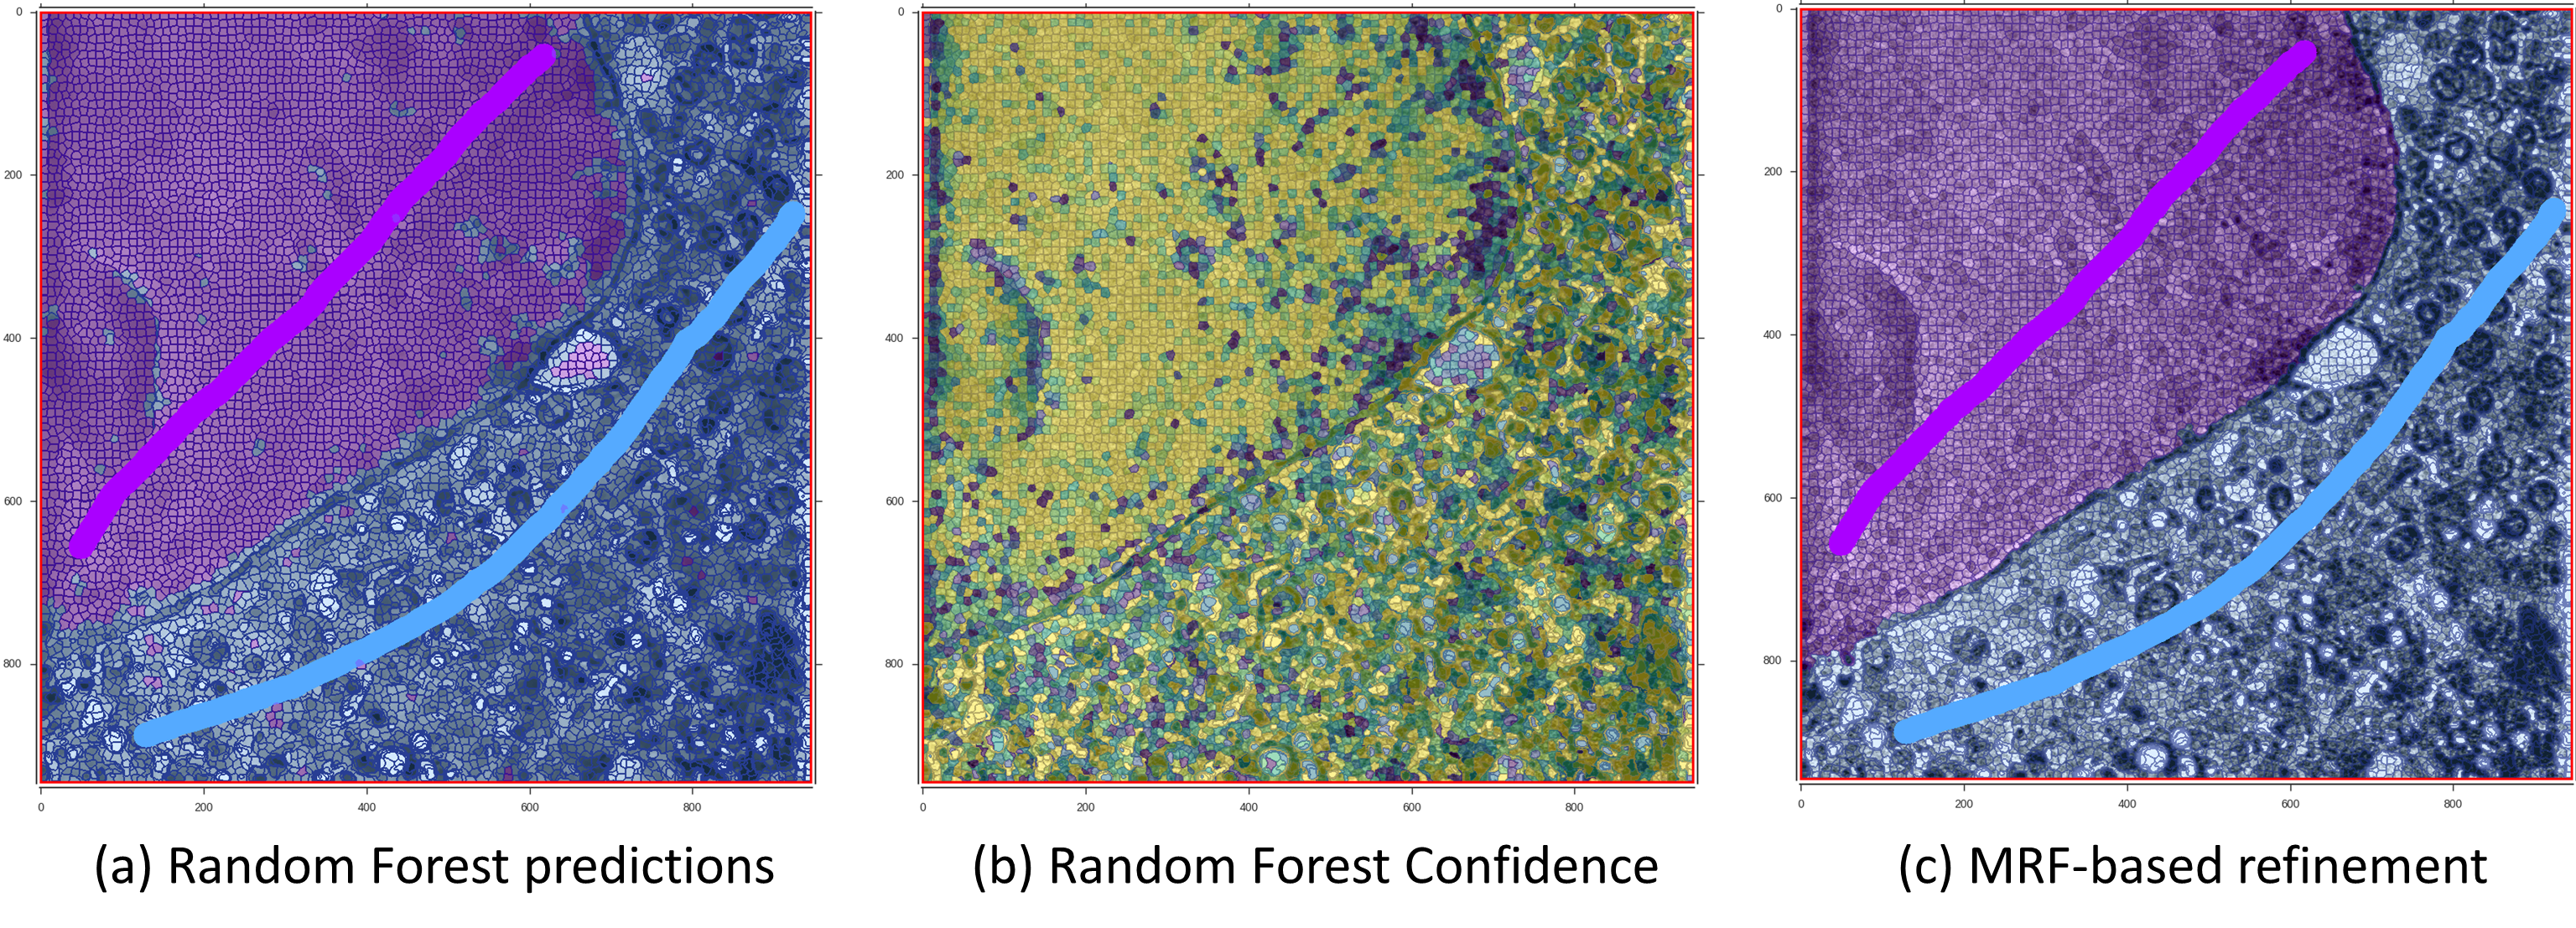
Machine learning models can be learnt from precomputed volume features (section 3.3), super-regions (section 3.4) and available user annotations (section 3.6). Features from user-annotated data are used to learn a predictive model to discriminate between different classes (e.g. nucleous and cytoplasm). These models can then be used to predict the most likely class for the rest of the supervoxels of the volume. This, however, produces sparse predictions that don’t have spatial consistency. The use of different MRF models can enforce spatial consistency to the predictions, resulting in improved and more smooth predictions.
Annotations
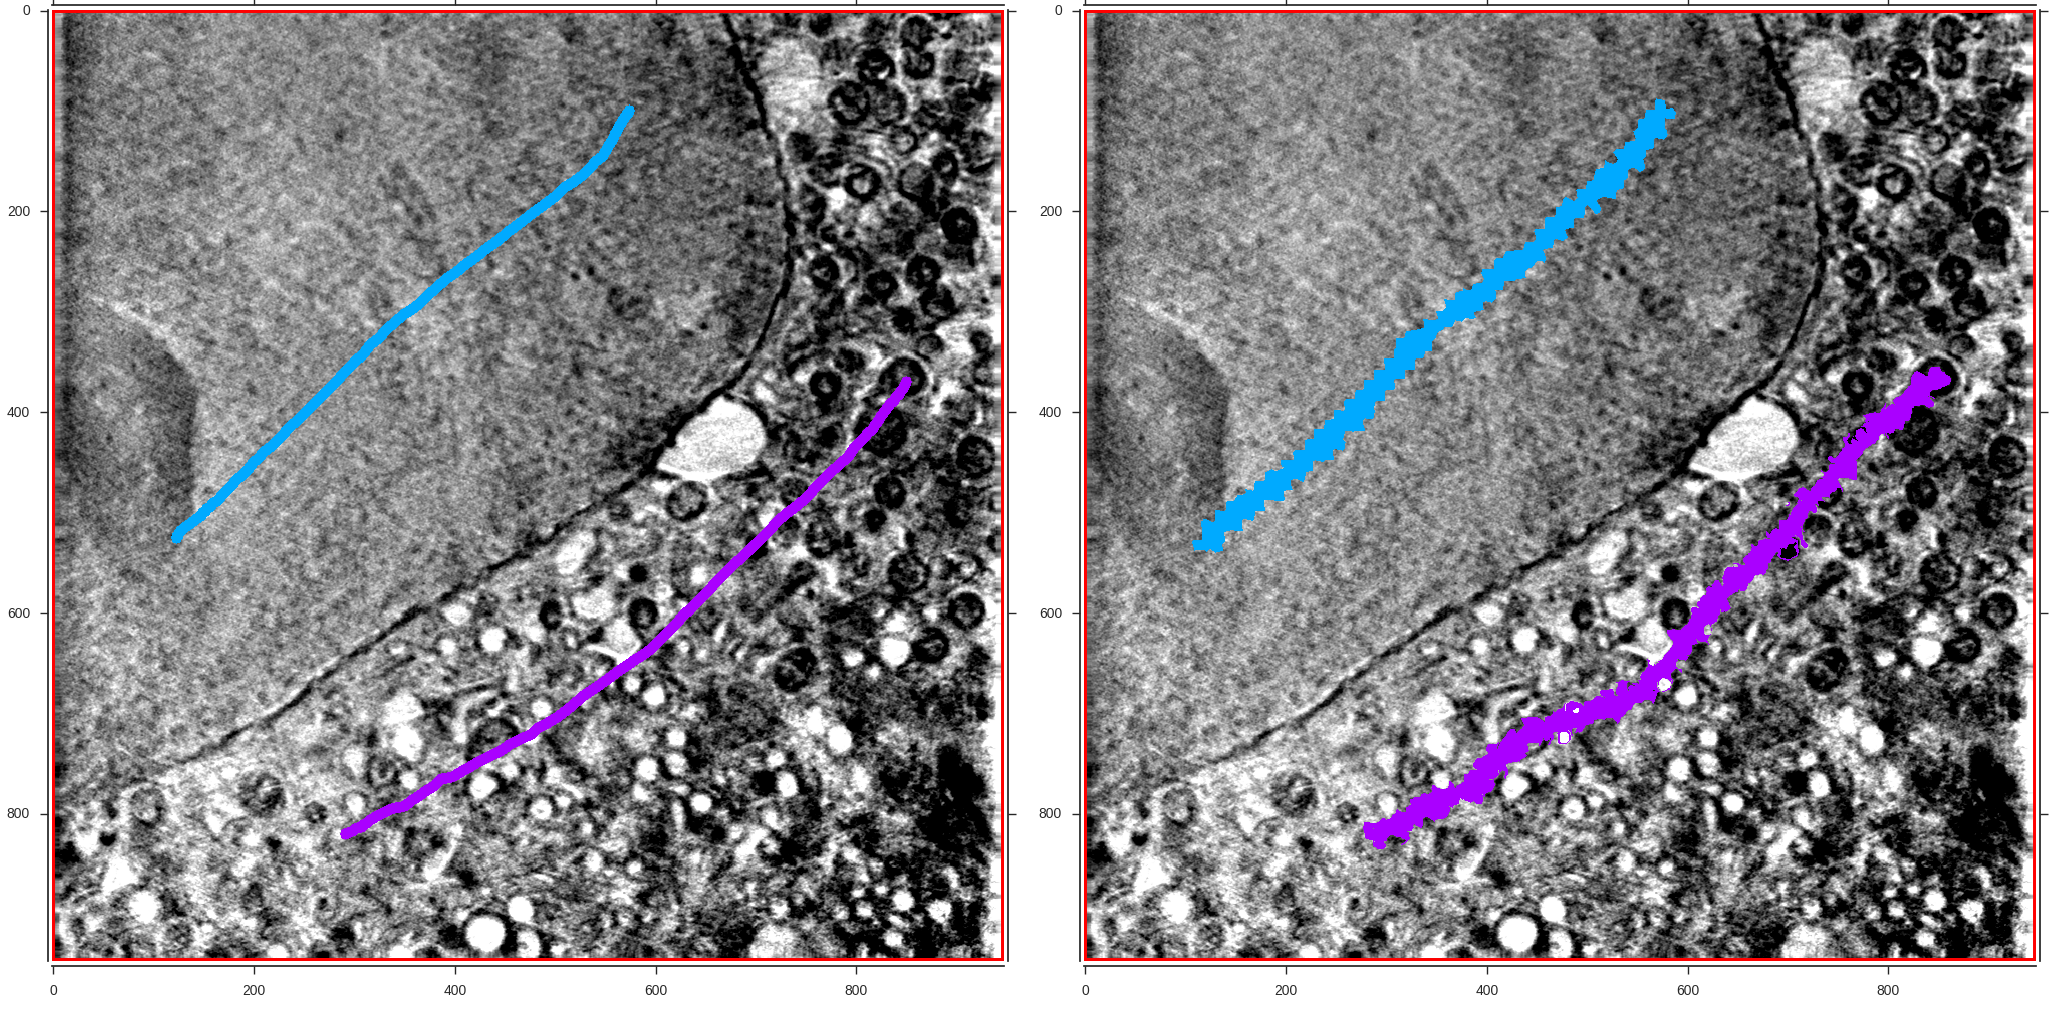
Different segmentation workflows (as explained in section 2) are available for the manual or semi-automatic segmentation of 3D volumes. Large areas or small objects of the volume can be annotated by clicking (or drawing) on top of previoysly calculated super-regions (voxels, supervoxels or megavoxels). Different colors are associated to different object classes (labels).
Export
Once the segmentation of the volume is finished, it can be exported in different formats:
- Labelled image
- Segmentation masks (binary masks, for each label).
- Masked data (masks for each of the labels where background is set to 0)
Label Splitter
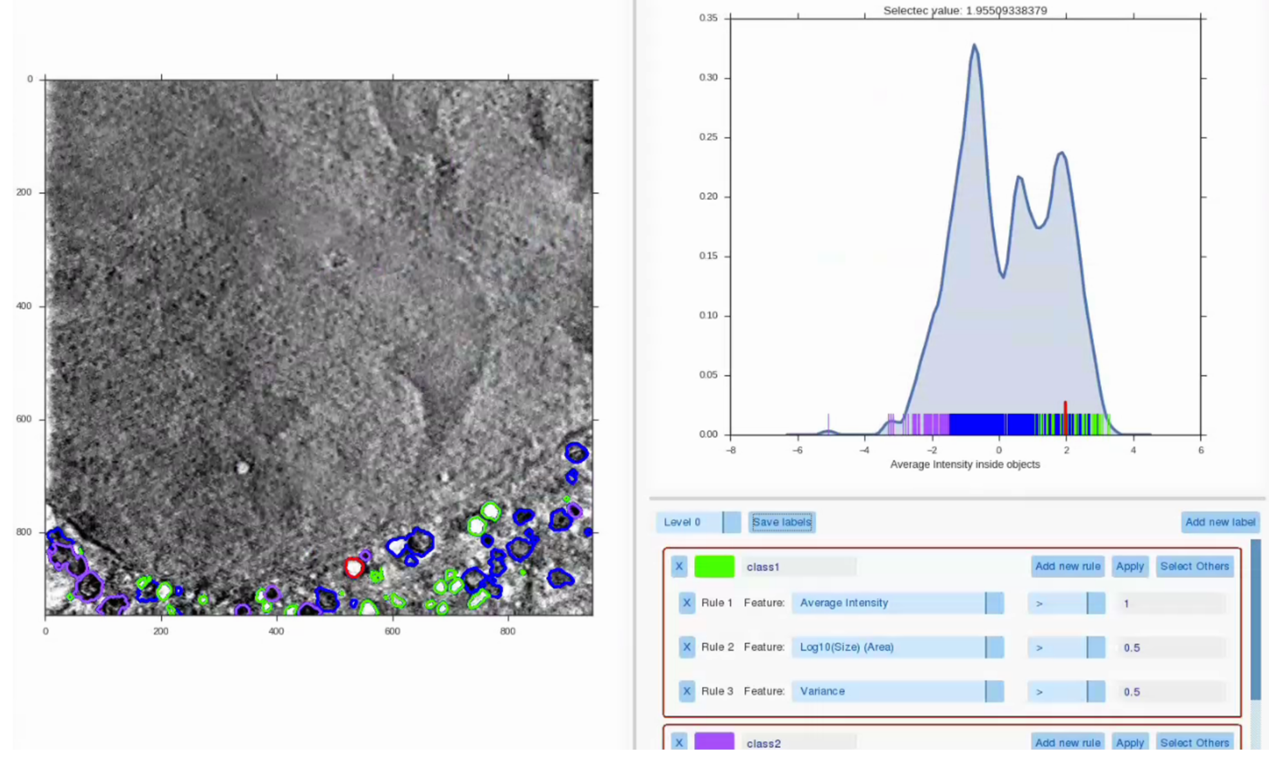
It might happen that some structures within the volume are impossible to differenciate just by looking at them. To overcome this, the Label Splitter allows the user to classify groups or individual objects within a previous segmentation. Using various measures extracted from each of the individual object (such as shape, size and average intensity within a selected feature channel) rules can be created to describe a type of object and segregate this type of object into a new class. Each of the objects can be manually selected to visualize its statistics, making the task more intuitive. Once the distinctions are made, results can be saved as new annotations.
Label Statistics
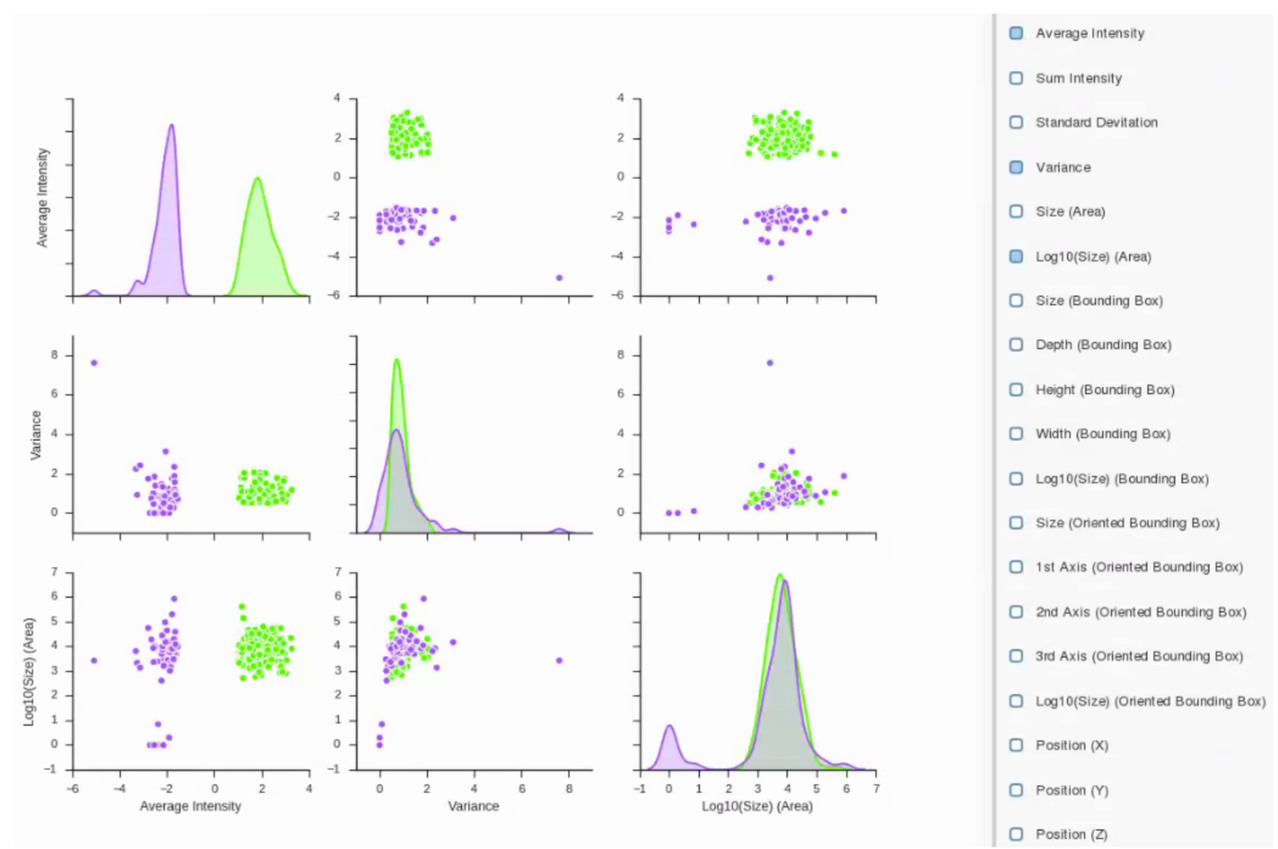
Label Statistics tool can be used to visualize relationships and output metrics for each object in a label. Plots for each of the metrics extracted for each label allow the user to visually examine the differences between them. Numerical metrics and plots can be exported as .CSV files or images for further analysis or figure preparation.