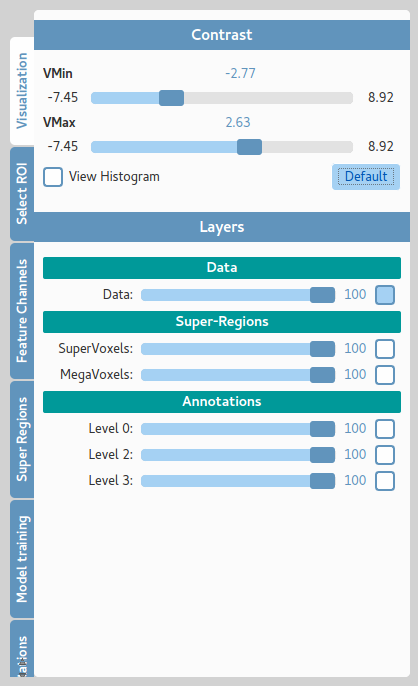
The visualization component is composed by Contrast and Layers tools. Every step on the SuRVoS’ workflow produces a temporary result that is stored in HDF5 format. These results are loaded into the visualization tool as layers. The loaded volume (raw data) itself is also loaded as another layer.
Contrast
The volume data might contain noise in the form of intensity peaks introduced either as artifacts during the reconstruction, as contrast agents (i.e. feducials) or as several other different artifacts particular to the imaging modality. These artifacts corrupt the contrast of the image. As soon as the data is loaded into SuRVoS, the contrast is automatically enhanced. As shown bellow, changing the contrast will affect visualization and can affect the whole segmentation process.
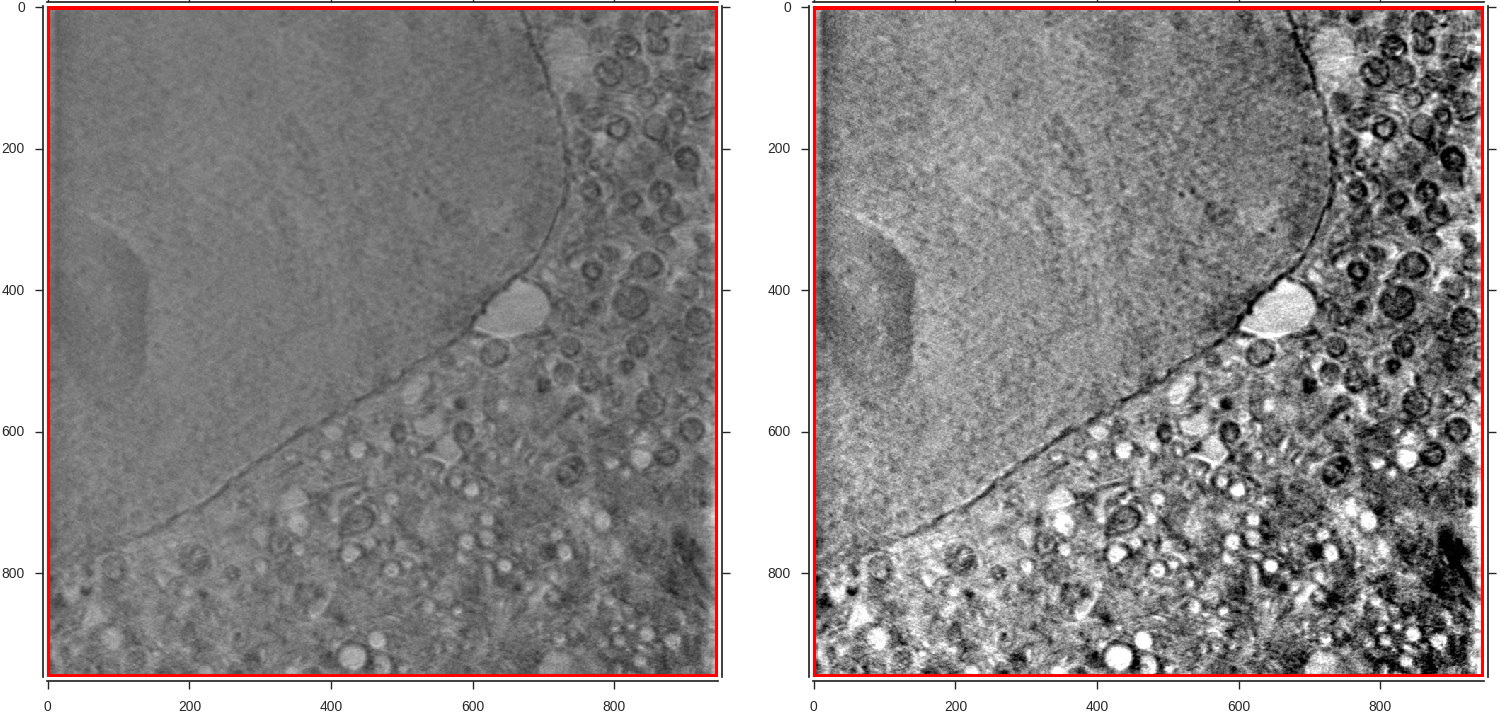
Left: central slice of a cryo-SXT volume. Right: same slice with the contrast automatically enhanced.
Layers
Allows visualization of previously precomputed results (e.g. features, predictions, super-regions). Each of the results is indicated as a different layer and its visibility and opacity can be controlled, allowing stacked visualization of different results:
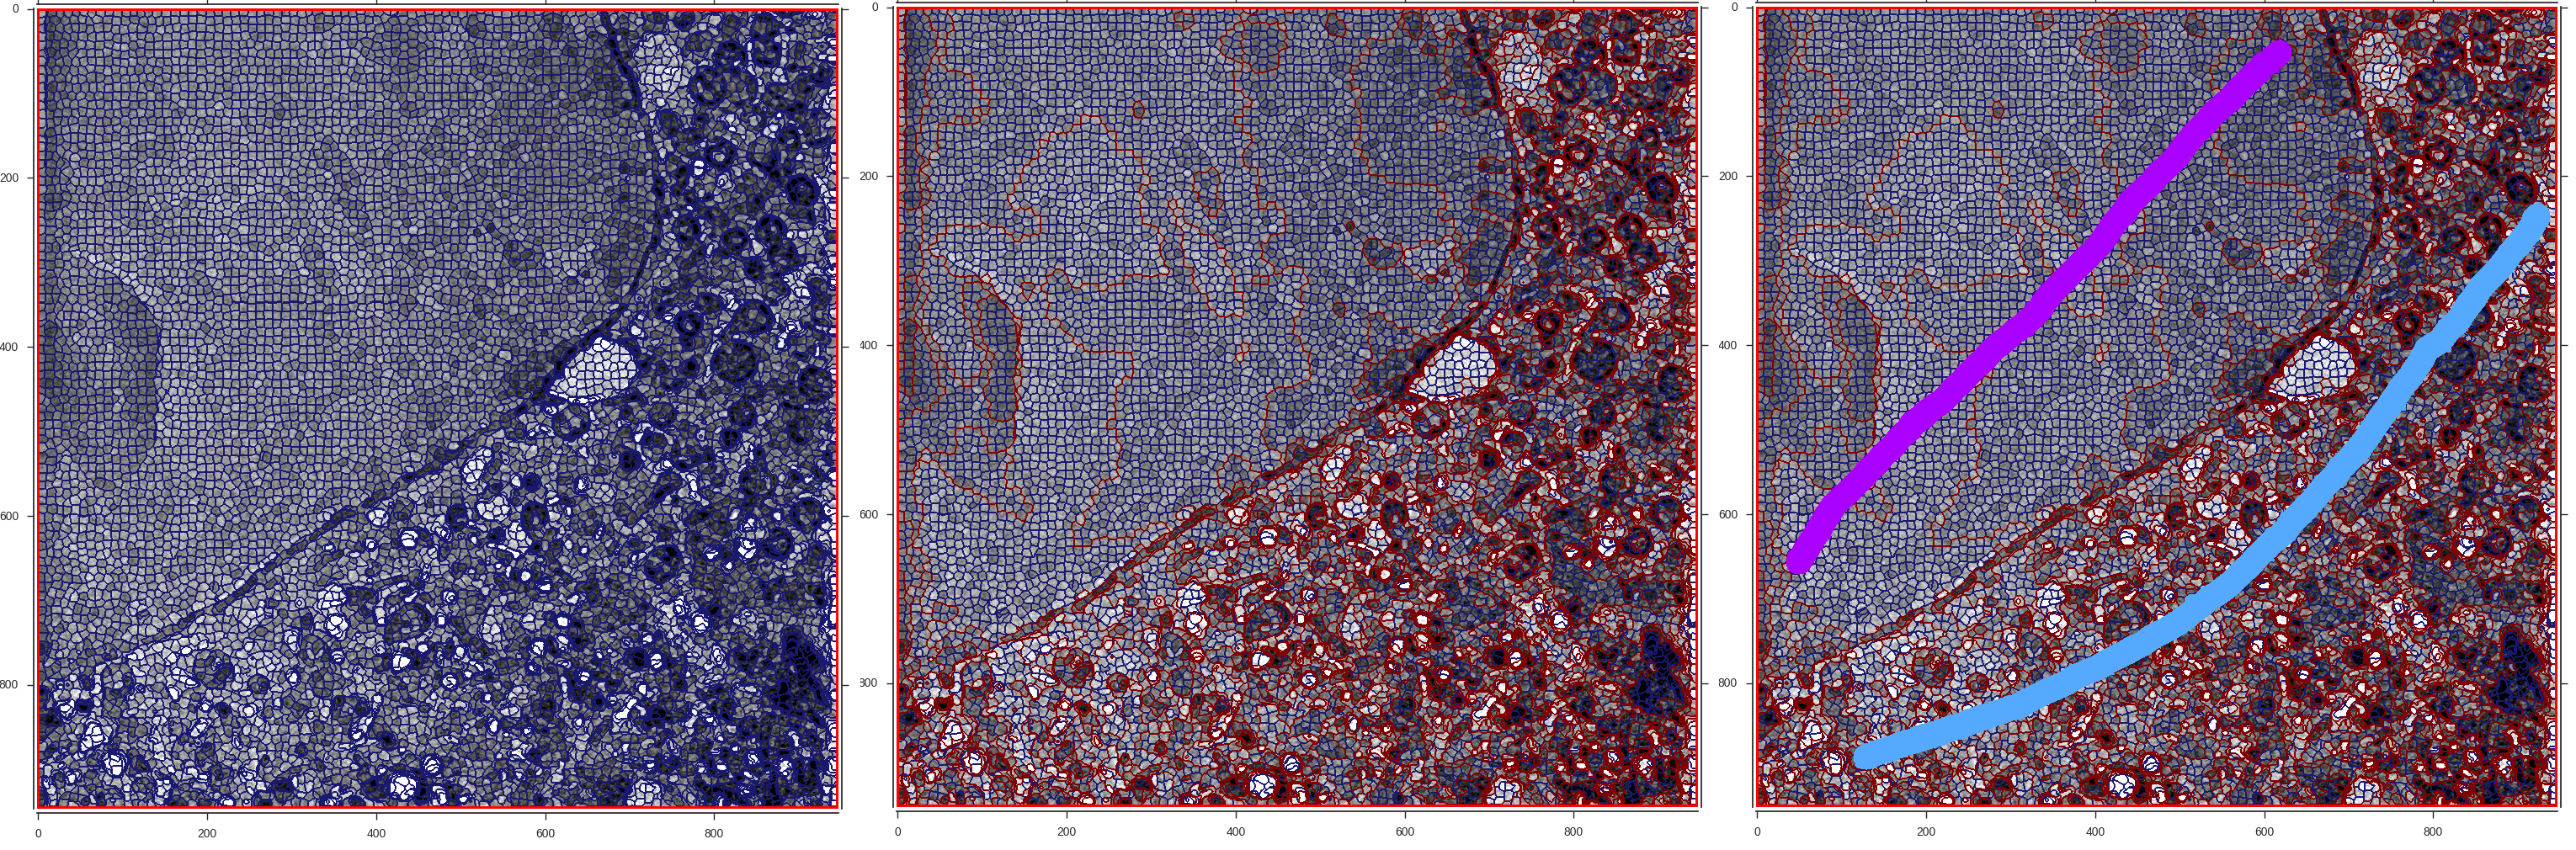
Left: central cryo-SXT slice with supervoxels (blue boundaries) overlaid on it. Middle: same slice with supervoxels and megavoxels (red boundaries) overlaid. Right: user made annotations also shown on top of super- and megavoxels.