Example 4 (real data)#
This example shows how to use methods from the HTTomolibgpy library to do the following:#
calculate the centre of rotation using the Vo Centering method for large real data
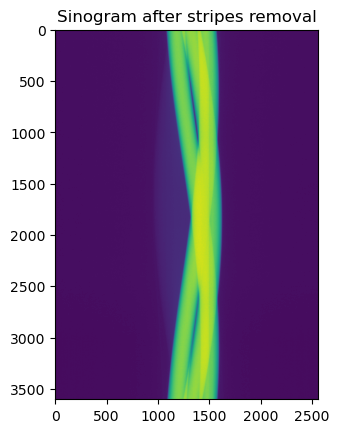
remove stripes using remove all stripes method
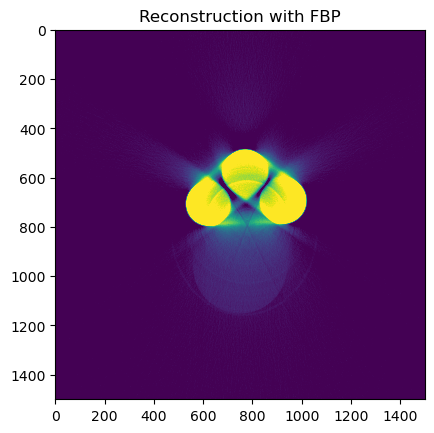
reconstruct using the FBP algorithm
[1]:
import os
import numpy as np
import cupy as cp
import scipy
import httomolibgpu
import matplotlib.pyplot as plt

# Load the sinogram data
path_lib = os.path.dirname(httomolibgpu.__file__)
in_file = os.path.abspath(
    os.path.join(path_lib, "..", "tests/test_data/", "3600proj_sino.npz")
)
l_infile = np.load(in_file)
sinogram = l_infile["sinogram"]
angles = l_infile["angles"]
sinogram = cp.asarray(sinogram)

print("The shape of the sinogram is {}".format(cp.shape(sinogram)))
The shape of the sinogram is (3601, 2560)
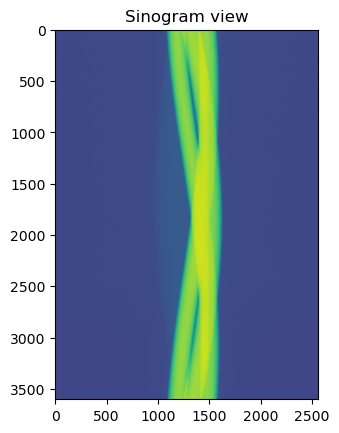
[2]:
plt.figure()
plt.imshow(sinogram.get())
plt.title("Sinogram view")
plt.show()

[3]:
from httomolibgpu.recon.rotation import find_center_vo

print("Finding the Center of Rotation for the reconstruction")
cor = find_center_vo(sinogram)
print("The found Center of Rotation is {}".format(cor))
Finding the Center of Rotation for the reconstruction
WARNING!!!Global minimum is out of searching range
Please extend smax: 12.5
The found Center of Rotation is 1333.25
[4]:
from httomolibgpu.prep.stripe import remove_all_stripe

print("Remove stripes using remove_all_stripe")

sino3d = cp.ascontiguousarray(
    cp.ones((sinogram.shape[0], 3, sinogram.shape[1])), dtype=cp.float32
)
sino3d[:, 1, :] = sinogram

sino3d = remove_all_stripe(sino3d)

plt.figure()
plt.imshow(sino3d[:, 1, :].get())
plt.title("Sinogram after stripes removal")
plt.show()
Remove stripes using remove_all_stripe

[5]:
print("Perform Reconstruction using FBP")
from httomolibgpu.recon.algorithm import FBP

reconFBP = FBP(sino3d, angles=angles, center=cor)
reconFBP_np = reconFBP.get()

plt.figure()
plt.imshow(reconFBP_np[500:2000, 1, 500:2000], vmin=0, vmax=0.01)
plt.title("Reconstruction with FBP")
plt.show()
Perform Reconstruction using FBP
