Outliers removal filter#
Description
Also called as a dezinger. Outliers removal filter is a part of the module httomolibgpu.misc.corr for data correction.
This method seeks the pixels/voxels that do not fit normally distributed data and replace them by using the Median filter. Essentially, dezinger is
a spatially variant median filter. The user needs to set the threshold parameter, based on which the filter will remove the outliers that are above
the chosen threshold. See the dif parameter of the remove_outlier method.
Mathematically, one can express the dezinger as:
Where
Note
Increasing the threshold value leads to the filter being more selective and decreasing the value makes it more like the normal median filter.
Where and how to use it:
Outliers removal filter should be used in situations when the data (projections or sinograms) contains pixels/voxels that do not belong to the surrounding area.
Usually, it looks like a salt-and-pepper noise or speckle-type noise, see Practical example bellow. In tomography, such
noise can be present because of the scattered X-rays and the quicker way to establish the need for the filter is to investigate the raw data visually. When removing
the outliers, it is preferable to avoid any modification of the data, therefore some experimentation with the
What are the adjustable parameters:
kernel_sizedefines the neighborhood size, seekernel_size = 3defines the neighborhood of 3 by 3 pixels (one needs to use only odd numbers). Increasingkernel_sizeresults in more smoothing applied, it is recommended to use the higher values when the clusters of pixels are large. As a rule of thumb, keepingkernel_sizewithin 7-11 range is a good trade-off. The limit is set to 13 currently.difdefines the threshold above which the value in the pixel is considered to be too high/low. Some empirical testing is usually required to establish the best trade-off.
Practical example:
In this example we demonstrate how the outliers, visible in sinogram and projection spaces can be removed from the data.
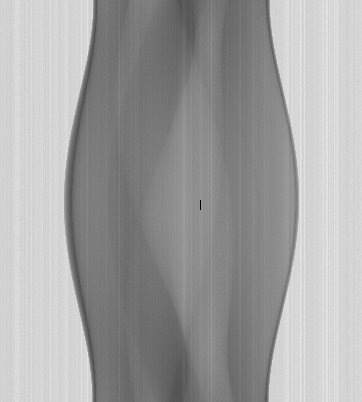
Fig. 7 Input (sinogram view) with a stripe of outliers in the middle of the image.# |
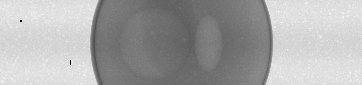
Fig. 8 Input (projection view) with some outliers in the left part of the image.# |
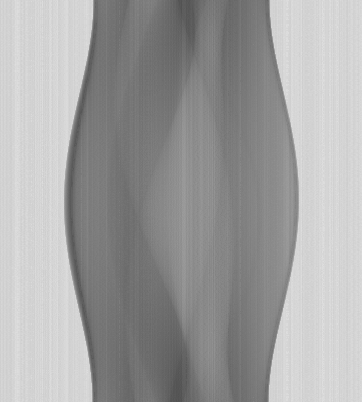
Fig. 9 After applying outliers removal (sinogram)# |
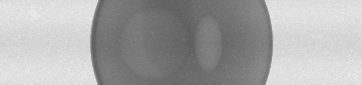
Fig. 10 After applying outliers removal (projection)# |
Fig. 11 Sinogram view of absolute residual between input and output. Note that the residual contains only removed outliers, we want to avoid smoothing the data.# |
Fig. 12 Projection view of absolute residual between input and output. Note that the residual contains only removed outliers, we want to avoid smoothing the data.# |