Phase-contrast enhancement#
Methods from the httomolibgpu.prep.phase module needed when the data requires phase contrast enhancement.
Description
In conventional X-ray tomography, image contrast comes mainly from absorption, i.e., how much a material attenuates X-rays. For some samples, especially biological, the absorption difference between structures can be insignificant and therefore the edge contrast can be lost. X-rays also undergo phase shifts when passing through materials with different refractive indices and these phase shifts carry valuable structural information that can be converted into contrast if properly reconstructed.
The phase contrast enhances edges and interfaces, revealing fine internal structure that pure absorption tomography would miss. When we record propagation-based phase contrast images (e.g., at a certain distance from the sample), the detected intensity includes a mixture of absorption and phase effects. To reconstruct a clean 3D volume, we must separate phase from intensity. This process is called the phase retrieval. The Paganin method [9] provides a simple, robust way to do this.
The Paganin formula is the following, see eq.10 in [10]:
where:
\(I(x, y, z = \Delta)\) - measured X-ray beam intensity at the propagation distance \(\Delta\).
\(I_{0}\) - measured X-ray beam intensity at the zero-distance from the X-ray source (incident beam).
\(\Delta > 0\) - propagation distance of the wavefront from sample to detector.
\(\mu\) - linear attenuation coefficient of the single-material object defined as \(\mu = 2k\beta\), where \(k=\frac{2\pi}{\lambda}\) is the wave-number corresponding to the vacuum wavelength \(\lambda\).
\(\delta\) - the phase decrement, related to the phase shift of X-rays. It is the real part of the complex refractive index: \(n = (1 - \delta) + i \beta\).
\(\beta\) - the absorption index, related to the attenuation. It the complex part of the material refractive index: \(n = (1 - \delta) + i \beta\).
One can re-write the formula above as:
where:
Where and how to use it:
Works well for single-material and relatively homogeneous or weakly heterogeneous samples (e.g., biological tissues, polymers, soft matter). The filter is particularly useful for weakly absorbing samples imaged with hard X-rays, where traditional absorption contrast is poor.
What are the adjustable parameters:
input datais the flat/dark normalised raw data before the negative log. Note that the \(-ln()\) operation is the part of the Paganin filter.pixel_sizeDetector pixel size (resolution) in MICRON units.distancePropagation distance (\(\Delta\)) of the wavefront from sample to detector in METRE units.energyIncident beam energy in keV.ratio_delta_betaThe ratio of \(\frac{\delta}{\beta}\) is a critical parameter as it defines how the algorithm balances phase contrast versus absorption contrast. Higher ratio values lead to stronger smoothing, more phase contrast recovered, but potential loss of edge sharpness. It is recommended to keep \(\frac{\delta}{\beta} > 250\) for weakly absorbing materials (like biological tissue, polymers, and light materials). Lower values \(\frac{\delta}{\beta} << 250\) lead to less smoothing, more edges preserved.
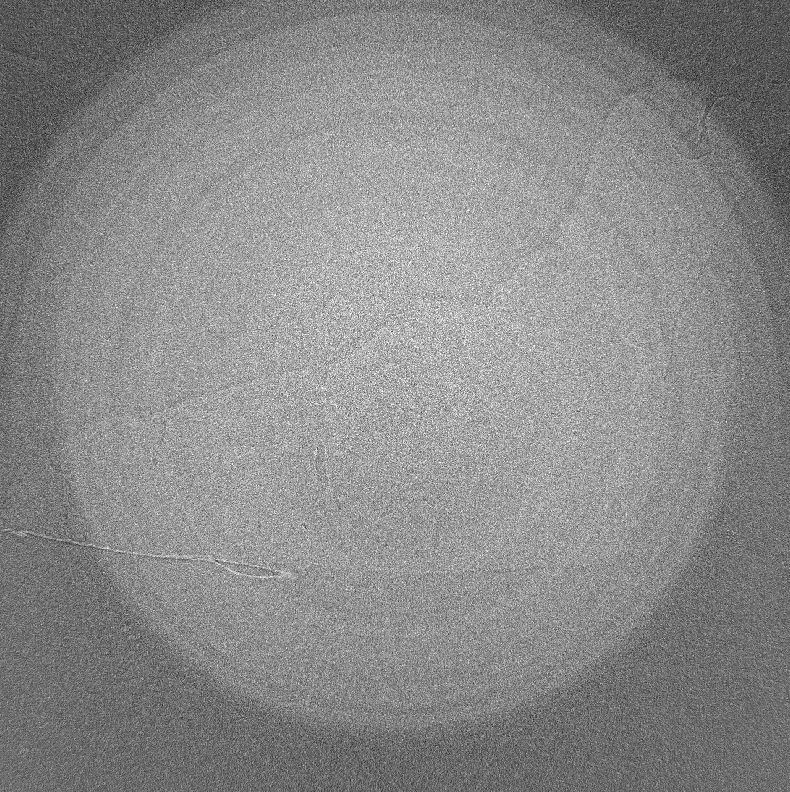
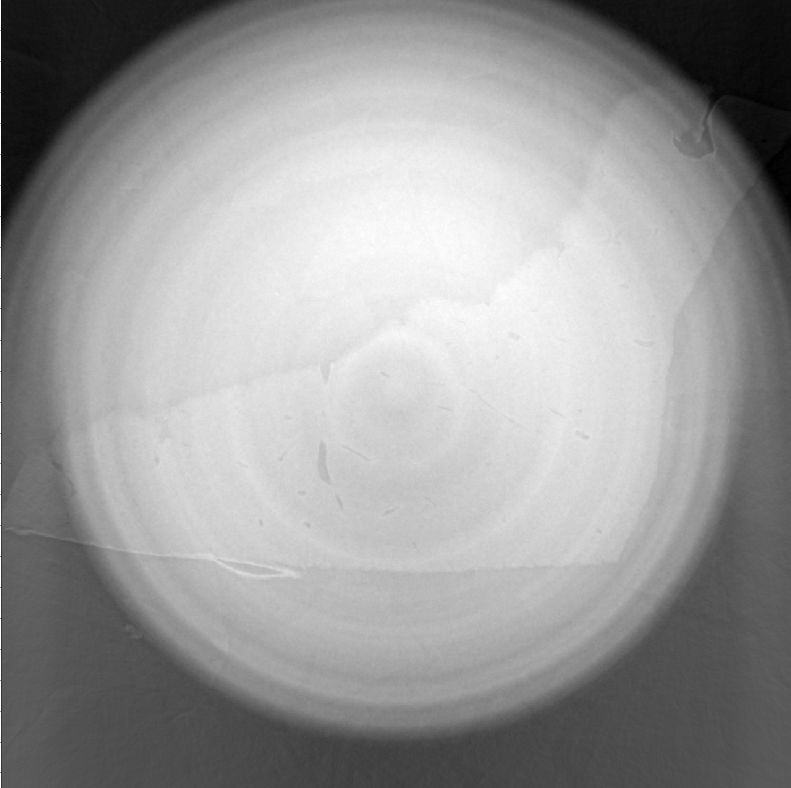
Real data examples:
In this section we will be applying Paganin filter to data obtained at Diamond Light Source I12 beamline (beamtime NT41036-2, PI: G. Burca). The sample is a set of fixed bovine liver sections in a centrifuge tube. This is a biological sample and a good candidate for Paganin filter demonstration.
We used Remove stripes combo to remove ring artifacts and Log-Polar 3D (ToMoBAR) for reconstruction of the filtered projections.
We also used the following parameters for Paganin filter, while varying only ratio_delta_beta.
pixel_size: 32.4 # microns
distance: 3.2    # meters
energy: 53.0     # KeV