Main GUI Screen
Running the application will launch the following screen:
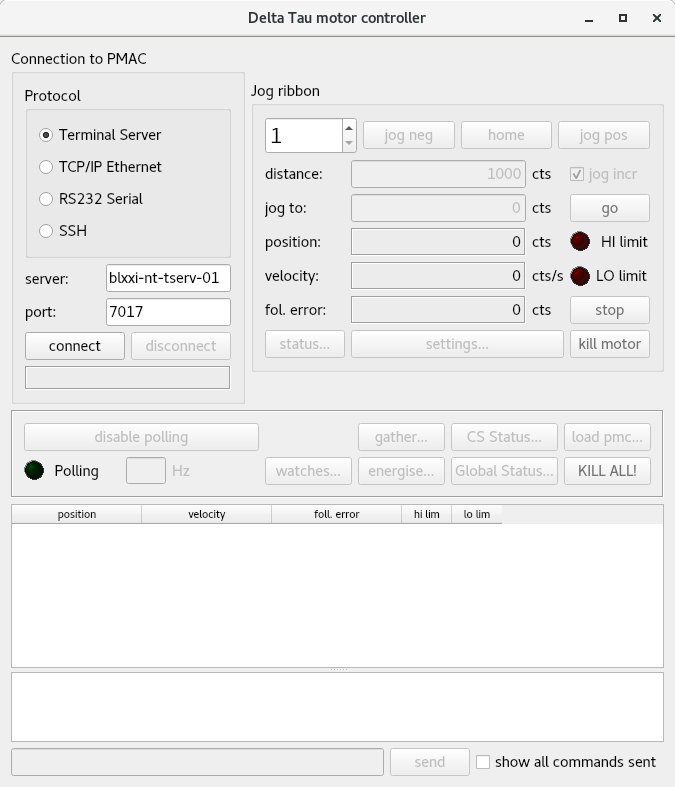
Fig. 1 GUI startup screen
The user must connect to a PMAC in order to access the various tools provided by the application.
Connection
The user can connect to a PMAC using Telnet, Ethernet, or Serial connection. Connection to a Power PMAC can be achieved via the SSH protocol.
To connect to the hardware select the connection type and press connect. There is the option of changing the connection parameters if required.
When connecting via SSH protocol, the default username and password will be used and if this fails then the following screen (Fig. 2) will be shown to promt the user for another username and password:
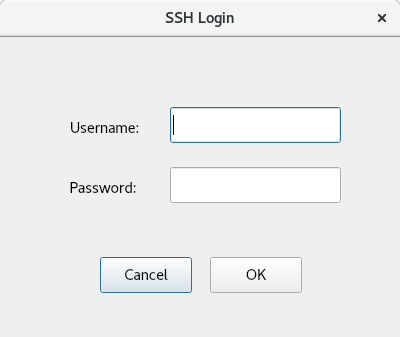
Fig. 2 Login screen to prompt user for SSH authentication
A pop-up window will be displayed if the connection fails for the PMAC (Fig. 3) or Power PMAC (Fig. 4). Examples of these are shown below.
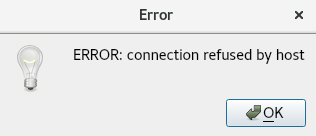
Fig. 3 Pop-up window for connection refused
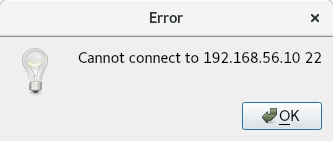
Fig. 4 Pop-up window for connection error
Upon successfully connecting the application will launch a screen similar to the following:
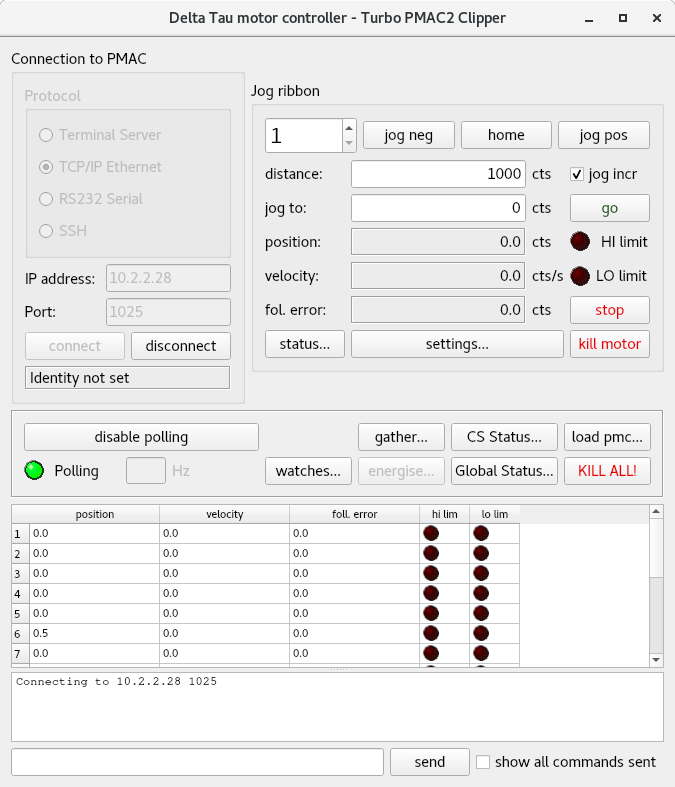
Fig. 5 GUI immediately after connecting
The user can now access the screens and features which have been enabled as shown in Fig. 5.
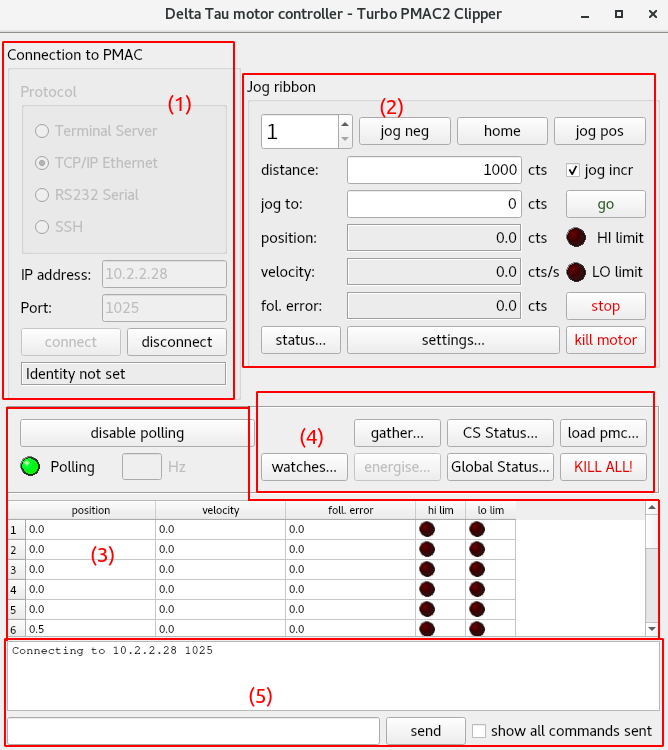
Fig. 6 Main GUI screen showing: (1) Connection protocol (2) Axis control (3) Polling window (4) Additional screens (5) Command window
Jog Ribbon
The jog ribbon can be found within the main screen (Fig. 6 (2)) and allows the user to move individual motors. The jog ribbon also shows the position, velocity, and following error of the current motor and shows LEDs which indicate whether a position limit has been reached.
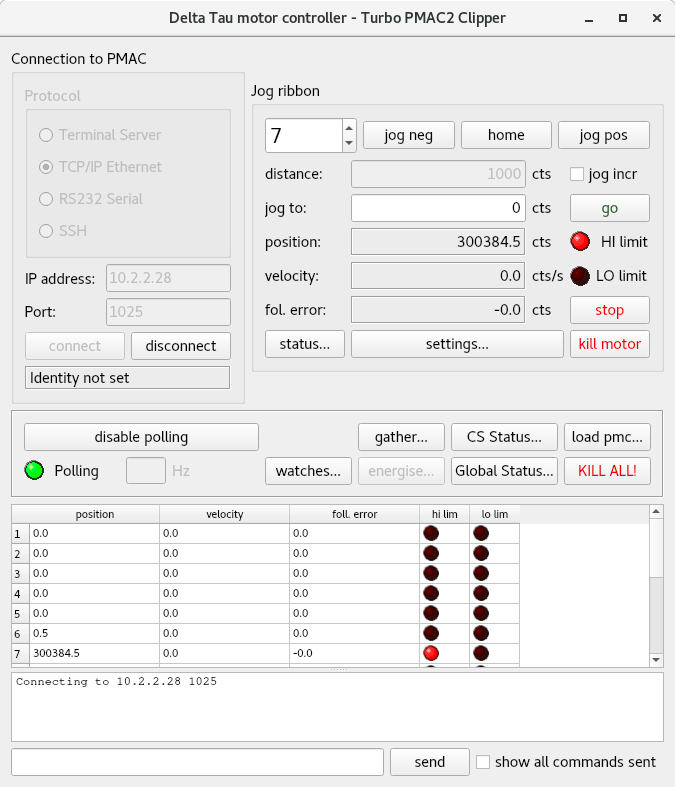
Fig. 7 Red LED indicating motor position limit reached
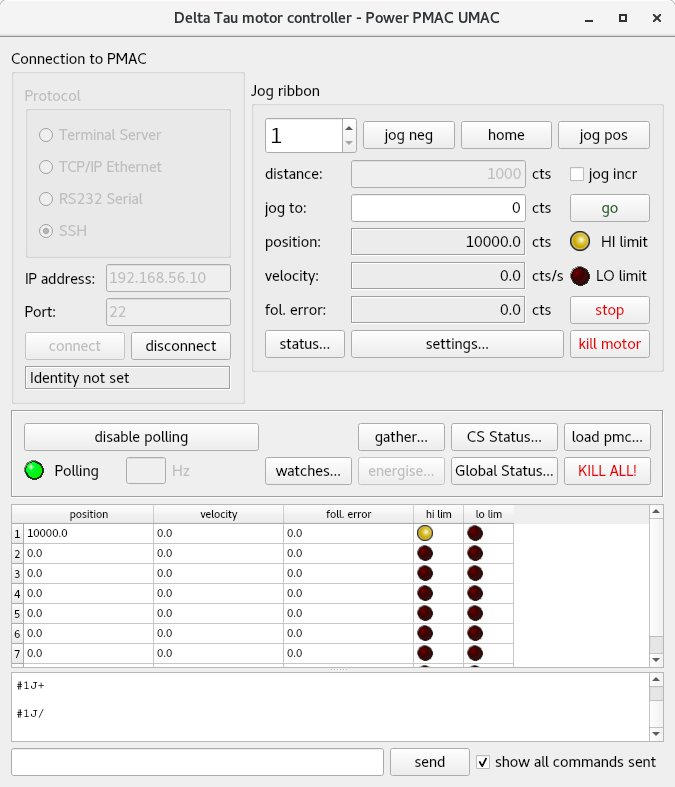
Fig. 8 Amber LED indicating software motor position limit reached
Note that for the Power PMAC these LEDs will be red when hardware limits have been reached and amber when software limits have been reached (see Fig. 8). LEDs are always red for PMAC (see Fig. 7) as there is no distinction between hardware and software limits.
Axis Settings
To configure the settings for a particular axis press the “settings…” button in the main screen (Fig. 6 (2)). This will launch the following screen which has two tabs for PMAC models:
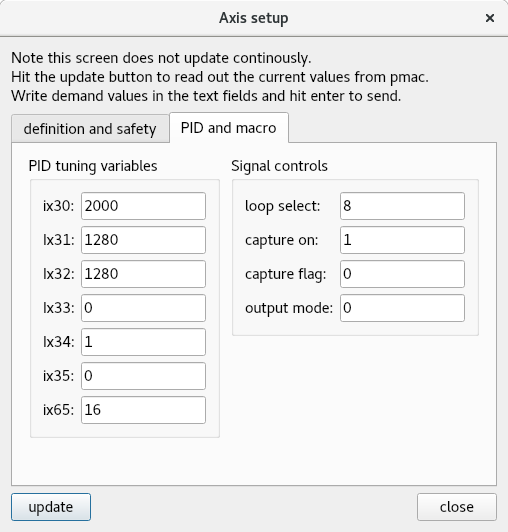
Fig. 9 PMAC Axis Settings (PID and macro variables)
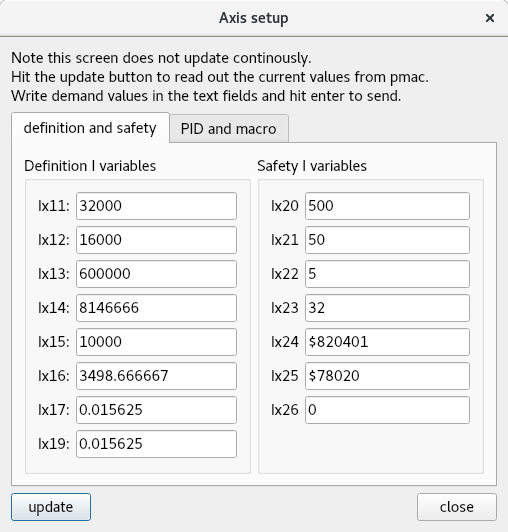
Fig. 10 PMAC Axis Settings (definition and safety variables)
The values shown on this screen can be edited by typing in new values and pressing enter. This will send a command to the hardware to set the variable to the desired value. It is expected that new values are in a format which can be interpreted by the PMAC and within an allowed range for that variable. Unlike in the polling table, values do not update periodically, instead the user must click update to read back values from the PMAC.
For the Power PMAC the axis settings screen is as follows:
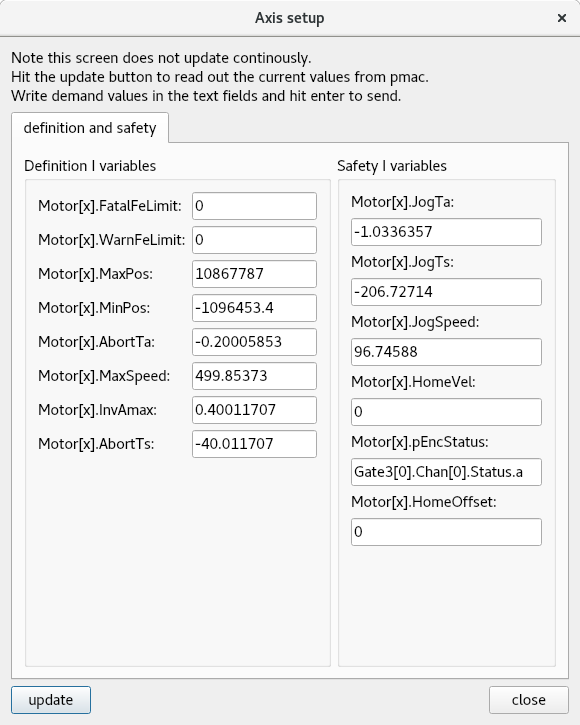
Fig. 11 Power PMAC Axis Settings
The screen shown in Fig. 11 can be used in the same way as for the PMAC.
Status Screens
There are three status screens available to the user. One displays motor status items, one shows status items for the coordinate system, and the other shows global status items. This screens will differ slightly for PMAC and Power PMAC.
To show the motor status screen press the “status…” button (shown in Fig. 6 (2)). Green LEDs will light up to show that the status bit has been set. The user can hover over each status item for a more in depth explanation of what it indicates.
The coordinate system status and global status screens can be found in the “additional screens” section ((4) Fig. 6).
Polling
The polling table (Fig. 6 (3)) shows the position, velocity, and following error of all the motors. LEDs which indicate whether a position limit has been reached are also displayed in the table. Note that for the Power PMAC an amber LED indicates a software limit and a red LED indicates a hardware limit.
The polling window is updated periodically by sending a command to the PMAC to request particular values.
Sending Commands
The application includes the option to send commands directly to the PMAC using the bar shown in the “command window” in the main window (Fig. 6 (5)). The checkbox labelled “show all commands sent” allows the option of displaying any commands sent by any other parts of the application. For example, when using the jog ribbon, if this box is ticked then any jog commands sent to the controller will be displayed in the command window.
Loading PLCs
The application allows the user to load a PLC line-by-line onto the PMAC. When the “load pmc…” button (found in Fig. 6 (4)) is pressed a window is launched which allows the user to choose a PLC from their local machine. Whilst the PLC is loading a progress bar is displayed. Note that if the PLC cannot be interpreted by the controller then the application may freeze while loading the PLC.