Setting Up Tristan Software
This document assumes that the Tristan detector sotware stack has been installed using the installation document. It will begin by setting up the detector software stack with:
1 simulator application instance.
1 Odin control server instance.
10 frameReceiver instances.
10 frameProcessor instances.
1 meta data application instance.
This set of applications can all be run on a single physical machine for testing purposes.
Once the initial setup has been completed this guide will show how to switch from using the simulator to a real detector.
Initial Steps
For all remaining sections of this setup guide it is assumed that source files and startup script are going to be located in the directory:
/home/tristan/
This directory will be referred to as the $SRC directory:
export SRC=/home/tristan
Create an application directory where all scripts to run the software will be placed:
cd $SRC
mkdir scripts
Setting Up The Odin Control server
The Odin control server requires a single configuration script and a single startup script. The configuration script tells the control server where to find the adapters required to communicate with the applications and detector, and it also sets up the web based GUI.
Start by creating the configuration file in the scripts directory:
cd $SRC/scripts
touch odin_server.cfg
Now edit the file and enter the following configuration lines:
[server]
debug_mode  = 0
http_port   = 12000
http_addr   = 0.0.0.0
static_path = /home/tristan/tristan-detector/control/latrd/odin/static
adapters    = fp, fr, tristan, meta_listener

[tornado]
logging = error

[adapter.tristan]
module = latrd.detector.tristan_control_adapter.TristanControlAdapter
endpoint = tcp://127.0.0.1:27654
firmware = 0.0.1

[adapter.fp]
module = odin_data.frame_processor_adapter.FrameProcessorAdapter
endpoints = 127.0.0.1:10004, 127.0.0.1:10014, 127.0.0.1:10024, 127.0.0.1:10034, 127.0.0.1:10044, 127.0.0.1:10054, 127.0.0.1:10064, 127.0.0.1:10074, 127.0.0.1:10084, 127.0.0.1:10094
update_interval = 0.2

[adapter.fr]
module = odin_data.frame_receiver_adapter.FrameReceiverAdapter
endpoints = 127.0.0.1:10000, 127.0.0.1:10010, 127.0.0.1:10020, 127.0.0.1:10030, 127.0.0.1:10040, 127.0.0.1:10050, 127.0.0.1:10060, 127.0.0.1:10070, 127.0.0.1:10080, 127.0.0.1:10090
update_interval = 0.2

[adapter.meta_listener]
module = odin_data.meta_listener_adapter.MetaListenerAdapter
endpoints = 127.0.0.1:5659
update_interval = 0.5
The configuration file contains the following sections:
- server
debug_mode - The debug level of the control server core code.
http_port - The control port that the control server will bind to.
http_addr - The control address that the control server will bind to.
static_path - A path that contains the static HTML files (GUI files) that will be served by the control server.
adapters - A list of adapter names that are defined later in this configuration file.
- tornado
logging - The logging level for the tornado server.
- adapter.tristan
module - The module where the source of this adapter is located.
endpoint - The detector hardware endpoint for connection.
firmware - The expected firmware version of the detector hardware.
- adapter.fp, adapter.fr, adapter.meta_listener
module - The module where the source of this adapter is located.
endpoints - A list of endpoints that this adapter will connect to. One adapter can connect to multiple applications.
update_interval - The rate at which the adapter will request status from the applications.
It is useful to create a startup script to run the control server. Create a file in the scripts directory:
cd $SRC/scripts
touch runOdinServer.sh
chmod 755 runOdinServer.sh
Now edit the file and add the following startup lines:
#!/bin/bash

SCRIPT_DIR="$( cd "$( dirname "$0" )" && pwd )"

source $SCRIPT_DIR/../venv27/bin/activate
tristan_odin --config=$SCRIPT_DIR/odin_server.cfg --logging=info
These two files should now be enough to start the control server:
./runOdinServer.sh
[I 210318 11:04:41 frame_processor_adapter:75] FP adapter initiated connection to FR adapter: fr
[I 210318 11:04:41 server:63] HTTP server listening on 0.0.0.0:12000
Once the control server is running it is now possible to open the GUI even if the control server is not yet connected to any of the other applications. Open a browser and navigate to http://localhost:12000 (assuming you are running the browser on the same machine as the control server). Once the page loads click on the “Home” button and you should see something similar to Figure 1 below.
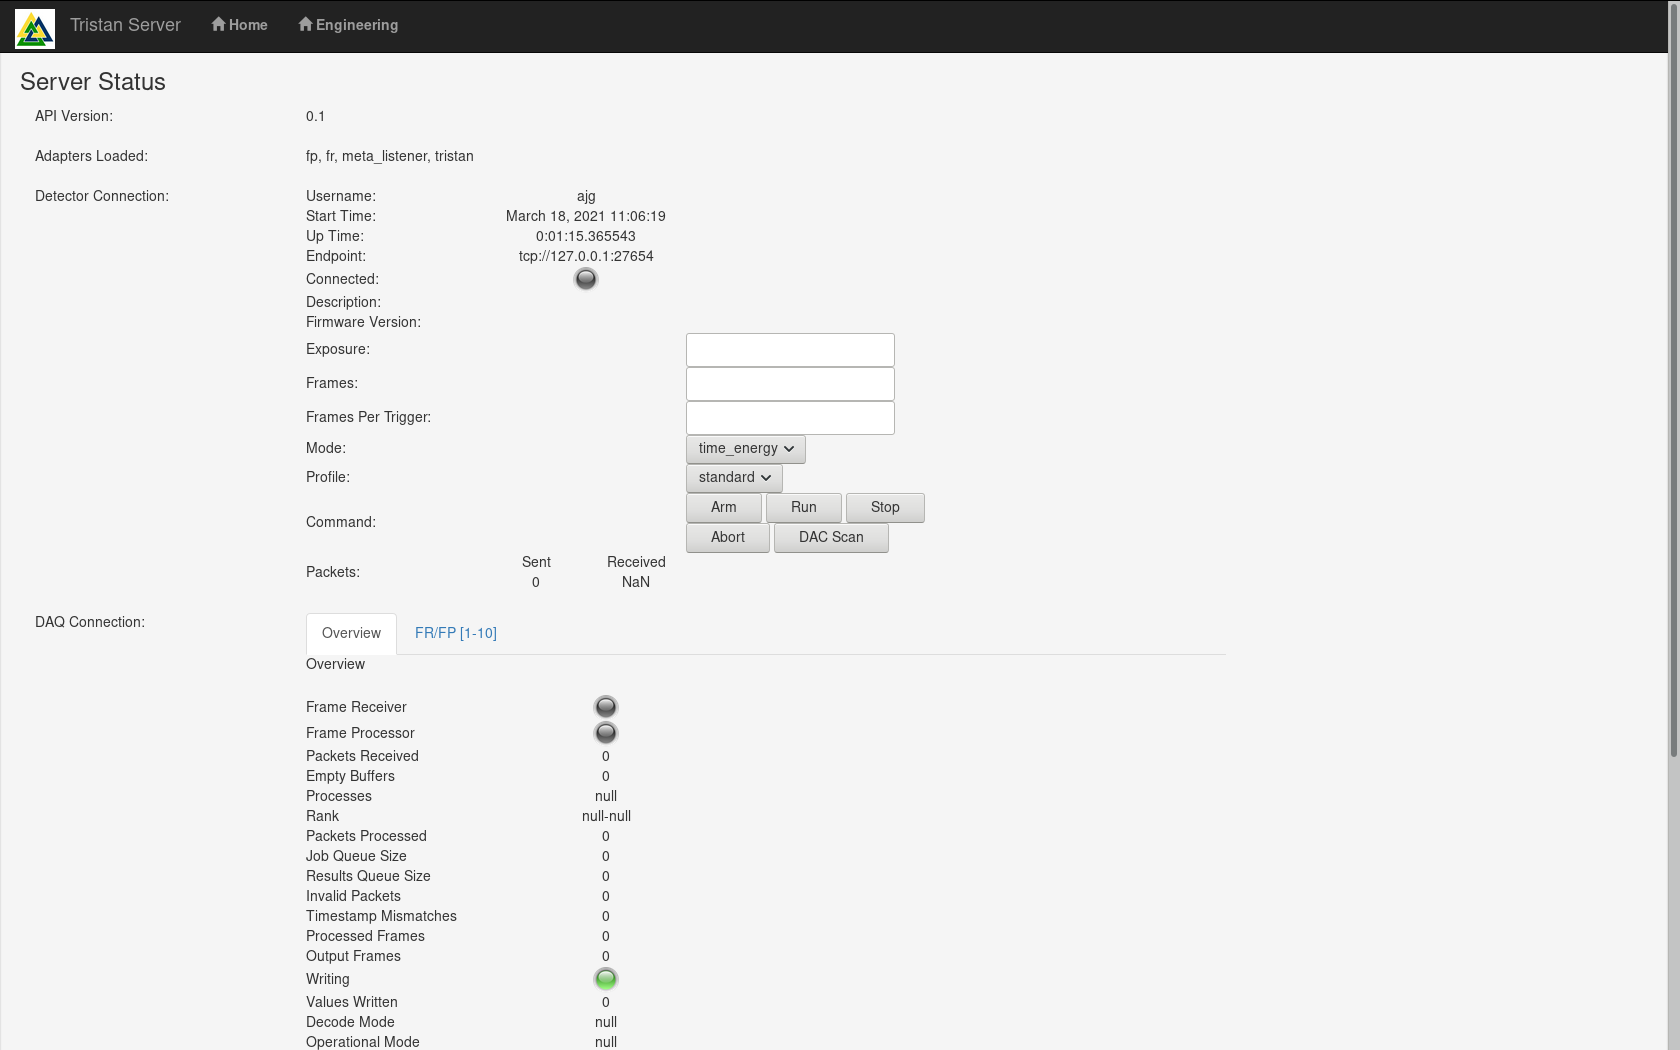
Figure 1. Main page of Tristan GUI running in browser.
The page shows some general information about the control server, including the API version, the username running the control server, the up time and the control hardware endpoint as well as the connection status. You can see that currently the control server is not connected, so we will start the simualator up to see the connection status change.
Setting Up The Simulator
Open a new terminal, and change directory to the scripts directory. Create a startup script for the simulator:
cd $SRC/scripts
touch runSimulator.sh
chmod 755 runSimulator.sh
Now edit the simulator startup file and add the following lines:
#!/bin/bash

SCRIPT_DIR="$( cd "$( dirname "$0" )" && pwd )"

source $SCRIPT_DIR/../venv27/bin/activate
tristan_simulator -c 0.0.0.0:12000 -m 10
The simulator can now be started:
./runSimulator.sh
Generated time slice 1
Generated time slice 2
...
Generated time slice 999
Generated time slice 1000
2021-03-19 12:31:14,031 Starting reactor...
2021-03-19 12:31:14,031 Registering <zmq.sugar.socket.Socket object at 0x7fcdaa9802f0> for polling
2021-03-19 12:31:14,593 Put params: {u'config': {u'time': u'2021-03-19T12:31+0000'}}
2021-03-19 12:31:14,594 Updated parameter Store: {'status': {'housekeeping': {'voltage_sense': [2.1, 2.1, 2.1, 2.1, 2.1, 2.1, 2.1, 2.1, 2.1, 2.1], ... 'mode': 'time_energy', 'time': u'2021-03-19T12:31+0000'}}
The simulator will first generate a series of data packet information (Generated time slice 1…) and then start its control connection. At this time the Odin control server will automatically establish a connection. This can be checked on the GUI; the “Connected” LED will turn green, and some of the other fields will be populated with information read out of the detector.
Now that the simulator is running we can setup the DAQ chain of applications.
Setting Up The Frame Receivers
Each frame receiver application requires a JSON configuration file and a startup script. The configuration file contains information relating to the specific decoder library to load, the port number to expect packets on and debug settings. Create a file called fr1.json:
cd $SRC/scripts
touch fr1.json
Now edit the file and add the following lines:
[
  {
    "decoder_type": "LATRD",
    "decoder_path": "/home/tristan/tristan-detector/install/lib",
    "rx_ports": "61649",
    "decoder_config": {
      "enable_packet_logging": false,
      "frame_timeout_ms": 1000
    }
  }
]
Create a file called runReceiver1.sh:
cd $SRC/scripts
touch runReceiver1.sh
chmod 755 runReceiver1.sh
Now edit the file and add the following lines:
#!/bin/bash

SCRIPT_DIR="$( cd "$( dirname "$0" )" && pwd )"

$SCRIPT_DIR/../odin-data/install/bin/frameReceiver --sharedbuf=odin_buf_1 -m 50000000 --iothreads 1 --ctrl=tcp://0.0.0.0:10000 --ready=tcp://127.0.0.1:10001 --release=tcp://127.0.0.1:10002 --json_file=$SCRIPT_DIR/fr1.json
The startup script for a receiver contains several command line options that are used here:
sharedbuf - The name of the shared memory buffer used to transfer frames from this application to the processing application.
maxmem (m) - The amount of memory allocated in bytes to the shared memory buffer.
iothreads - The number of IPC channel threads used by this application.
ctrl - The control channel endpoint (used by the control server).
ready - The frame ready channel endpoint (to notify the processing application).
release - The frame release channel endpoint (to receive notification processing is complete for a buffer).
json_file - The location of the JSON configuration file that contains additional setup information
It is necessary to make ten (10) copies of these files, one for each receiving application required. Each application instance will need different port numbers for the endpoints. These are all defined in the table below:
Application |
JSON rx_ports |
Command sharedbuf |
Command ctrl |
Command ready |
Command release |
|---|---|---|---|---|---|
1 |
61649 |
odin_buf_1 |
|||
2 |
61650 |
odin_buf_2 |
|||
3 |
61651 |
odin_buf_3 |
|||
4 |
61652 |
odin_buf_4 |
|||
5 |
61653 |
odin_buf_5 |
|||
6 |
61654 |
odin_buf_6 |
|||
7 |
61655 |
odin_buf_7 |
|||
8 |
61656 |
odin_buf_8 |
|||
9 |
61657 |
odin_buf_9 |
|||
10 |
61658 |
odin_buf_10 |
Once the files are ready they can be started. As each application starts up the control server will automatically connect. Clicking on the tab “FR/FP [1-10]” in the GUI shows the individual status of each receiver application. Once they have all started the screen should display a green LED for each Frame Receiver application.
Setting Up The Frame Processors
Each frame processor application requires a JSON configuration file and a startup script. The configuration file contains information relating to the specific processing library to load, the port numbers for communicating with the corresponding frame receivers, and the layout of the datasets that will be required to save the Tristan data.
Create a file called fp1.json:
cd $SRC/scripts
touch fp1.json
Now edit the file and add the following lines:
[
{
    "fr_setup": {
    "fr_ready_cnxn": "tcp://127.0.0.1:10001",
    "fr_release_cnxn": "tcp://127.0.0.1:10002"
    },
    "meta_endpoint": "tcp://*:10008"
},
{
    "plugin": {
    "load": {
        "index": "tristan",
        "name": "LATRDProcessPlugin",
        "library": "/home/tristan/tristan-detector/install/lib/libLATRDProcessPlugin.so"
    }
    }
},
{
    "plugin": {
    "load": {
        "index": "hdf",
        "name": "FileWriterPlugin",
        "library": "/home/tristan/odin-data/install/lib/libHdf5Plugin.so"
    }
    }
},
{
    "plugin": {
    "connect": {
        "index": "tristan",
        "connection": "frame_receiver"
    }
    }
},
{
    "plugin": {
    "connect": {
        "index": "hdf",
        "connection": "tristan"
    }
    }
},
{
    "hdf": {
    "dataset": {
        "data": {
        "datatype": "uint32",
        "chunks": [1]
        }
    }
    }
},
{
    "hdf": {
    "dataset": {
        "raw_data": {
        "datatype": "uint64",
        "chunks": [524288]
        }
    }
    }
},
{
    "hdf": {
    "dataset": {
        "event_id": {
        "datatype": "uint32",
        "chunks": [524288]
        }
    }
    }
},
{
    "hdf": {
    "dataset": {
        "event_time_offset": {
        "datatype": "uint64",
        "chunks": [524288]
        }
    }
    }
},
{
    "hdf": {
    "dataset": {
        "event_energy": {
        "datatype": "uint32",
        "chunks": [524288]
        }
    }
    }
},
{
    "hdf": {
    "dataset": {
        "image": {
        "datatype": "uint16",
        "dims": [512, 2048],
        "chunks": [1, 512, 2048]
        }
    }
    }
},
{
    "hdf": {
    "dataset": {
        "cue_timestamp_zero": {
        "datatype": "uint64",
        "chunks": [524288]
        }
    }
    }
},
{
    "hdf": {
    "dataset": {
        "cue_id": {
        "datatype": "uint16",
        "chunks": [524288]
        }
    }
    }
},
{
    "hdf": {
    "dataset": {
        "time_slice": {
        "datatype": "uint32",
        "chunks": [40]
        }
    }
    }
},
{
    "tristan": {
    "process": {
        "number": 10,
        "rank": 0
    },
    "sensor": {
        "width": 4096,
        "height": 2560
    }
    }
},
{
    "hdf": {
    "process": {
        "number": 10,
        "rank": 0
    }
    }
},
{
    "hdf": {
    "dataset": "data"
    }
}
]
Create a file called runProcessor1.sh:
cd $SRC/scripts
touch runProcessor1.sh
chmod 755 runProcessor1.sh
Now edit the file and add the following lines:
#!/bin/bash

SCRIPT_DIR="$( cd "$( dirname "$0" )" && pwd )"

$SCRIPT_DIR/../odin-data/install/bin/frameProcessor --ctrl=tcp://0.0.0.0:10004 --json_file=$SCRIPT_DIR/fp1.json
The startup script for a receiver contains command line options that are used here:
ctrl - The control channel endpoint (used by the control server).
json_file - The location of the JSON configuration file that contains additional setup information
It is necessary to make ten (10) copies of these files, one for each processing application required. Each application instance will need different port numbers for the endpoints. These are all defined in the table below:
Application |
JSON fr_ready_cnxn |
JSON fr_release_cnxn |
JSON meta_endpoint |
JSON rank |
Command ctrl |
|---|---|---|---|---|---|
1 |
0 |
||||
2 |
1 |
||||
3 |
2 |
||||
4 |
3 |
||||
5 |
4 |
||||
6 |
5 |
||||
7 |
6 |
||||
8 |
7 |
||||
9 |
8 |
||||
10 |
9 |
Once the files are ready they can be started. As each application starts up the control server will automatically connect. Clicking on the tab “FR/FP [1-10]” in the GUI shows the individual status of each processor application. Once they have all started the screen should display a green LED for each Frame Processor application.